


Dynamics 365 Remote Cost Analysis
March 3, 2020
Recently a customer running Microsoft Dynamics approached Login VSI to see if we could help resolve the performance issues they were encountering with remote users.
The customer was in Europe, but most of their workforce was in the United States. Most complaints about performance were from their employees on the west coast.
Login VSI was able to design workload interactions to mimic the user behavior and measure the interactions over several months. This allowed Login VSI to create a baseline around user interactions, within the specific apps causing issues.
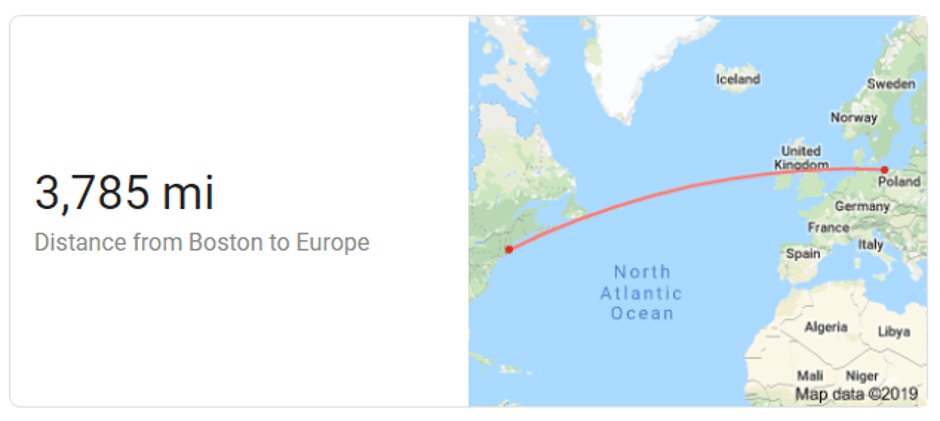
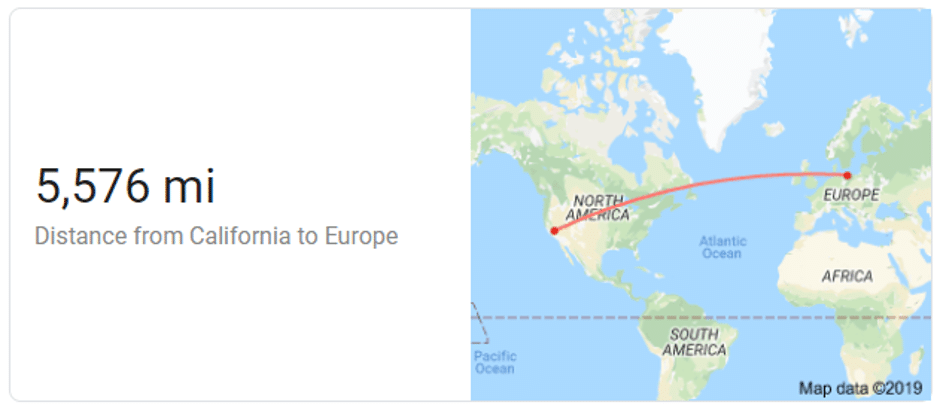
Distance between the east coast, west coast and Europe:
By applying service level agreements evenly for profiles performing remote interactions in both Boston and San Diego we were able to determine the degree by which each profile adhered as well as the cost basis for the performance gap between users.
The Scientific Approach A workflow was created to mimic the sales representative behavior of Microsoft’s hosted Dynamics 365 CRM. The Dynamics 365 CRM tenant was selected based upon proximity to the original location of the business headquarters. Location of Dynamics 365 host:
- Microsoft Dynamics 365 EU Tenant
In order to observe the impact of relative distance to the location of the hosted application and its impact on sales user experience, we needed to set up two physical devices running Login VSI Enterprise. These physical devices were located:
Boston, MA
San Diego, CA
Our customer’s US business operations are driven out of Boston, and therefore this was normalized to the baseline sales user experience. Based upon transaction deviations evenly applied to both profiles we were able to quantify the impact of location on productivity.
We collected the data for a one-month period, and concluded that:
- Impact to transaction speed in San Diego is approximately 36%
- Two hours and fifty-three minutes per eight hours’ worth of CRM transactions
- This equates to $66,000 total for our example company in wages. At a minimum you are losing $66,000 and, on a maximum, you are losing $576,000.
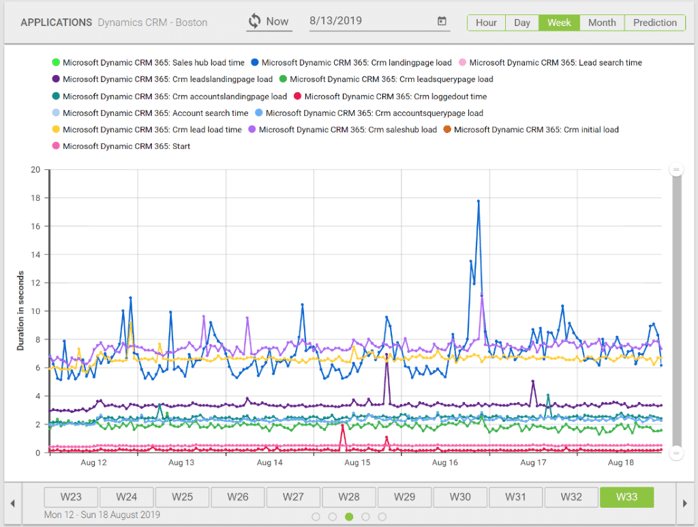
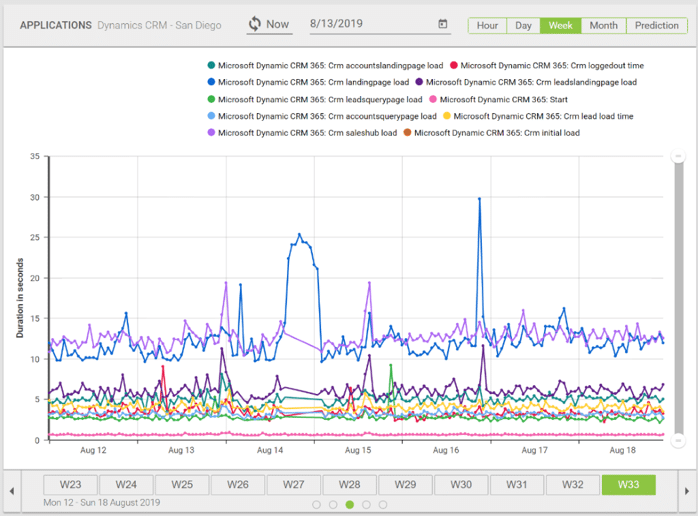
Below you can see two of the SLA reports that were generated from Login VSI.
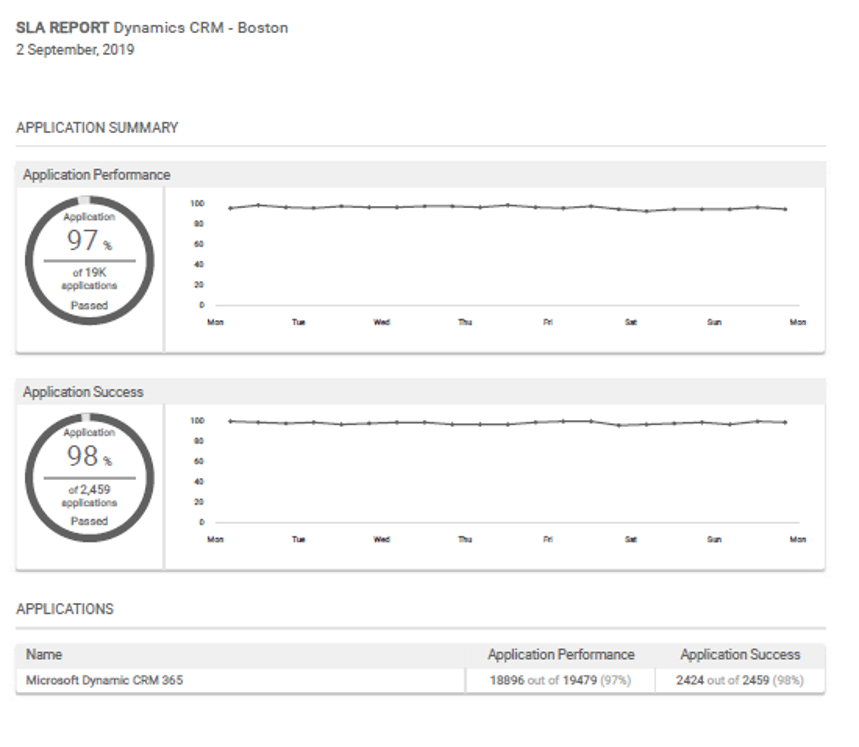
Figure 1. Boston Profile SLA adherence
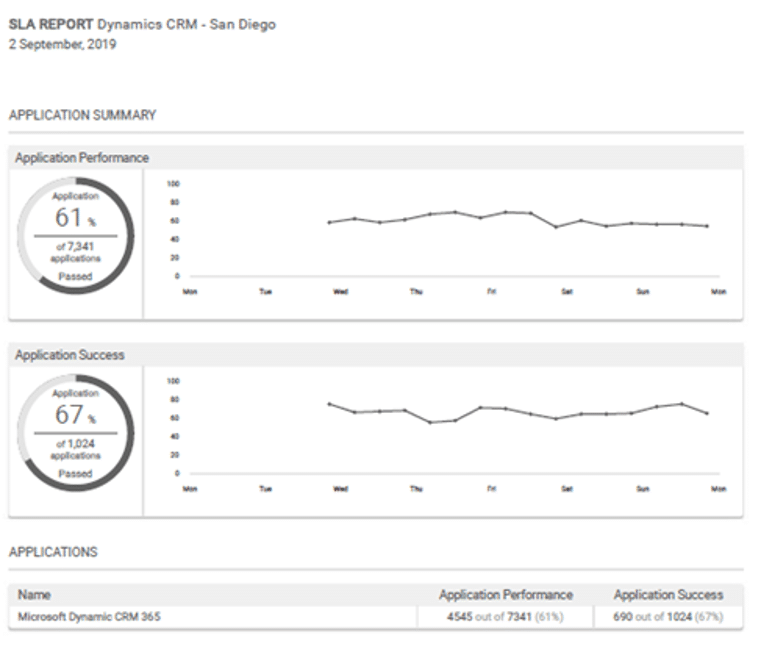
Figure 2 San Diego Profile SLA adherence
Transaction speeds based upon geography can have a real impact on your business. It is critical to understand the cost of the decision when architecting your CRM or other software solutions. This also ensures that transaction speeds are consistent for your globally dispersed workforce, and the cause of your sales bottleneck is not your management software.
If you are interested in understanding the user experience of your remote users, please reach out!
Application PerformanceMicrosoft


