
Adapt the Report, Keep the Evidence | Workspace Weekly
October 23, 2026
Describe the Login Enterprise report you need to an AI assistant, then use the Results Toolkit to create a shareable HTML report and an editable Power BI project.
That could be a Windows migration comparison for management, an application review for engineering, or a report you want to adapt for another audience. The selected evidence stays with the comparison as you change the presentation.
In Make Login Enterprise Comparisons Easier to Repeat, I introduced the Login Enterprise Results Toolkit. I built it to help teams retrieve, compare, and reuse their results, with optional AI skills for Codex and Claude Code alongside direct commands. This week, I’ll show how a reporting request becomes HTML and editable Power BI, then refine the report for a management meeting.
The toolkit is an unsupported community preview, not a Login VSI-supported product. This example uses authored synthetic data throughout.
Start with the Reporting Need
Here is the example request:
I'm reviewing a candidate Windows 11 image against a Windows 10 baseline. Give me a report that helps an engineering lead understand application timing changes and whether the compared workloads completed successfully. I want a portable HTML report and an editable Power BI report, using the same evidence and calculations.Windows 10 and Windows 11 are declared scenario roles here. These are not verified environments or Windows benchmark results.
The toolkit keeps the selected source records with the comparison definition. Baseline and candidate identities are explicit, as are each action’s metric and unit. The milliseconds below are authored fixture units; they do not establish the units of an arbitrary appliance timer.
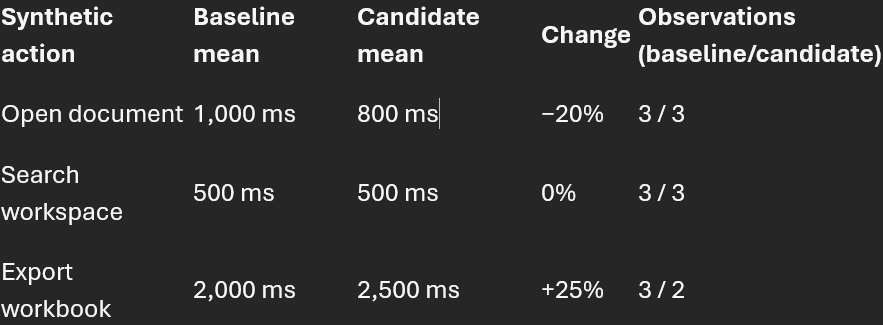
Both reports use that same verified comparison
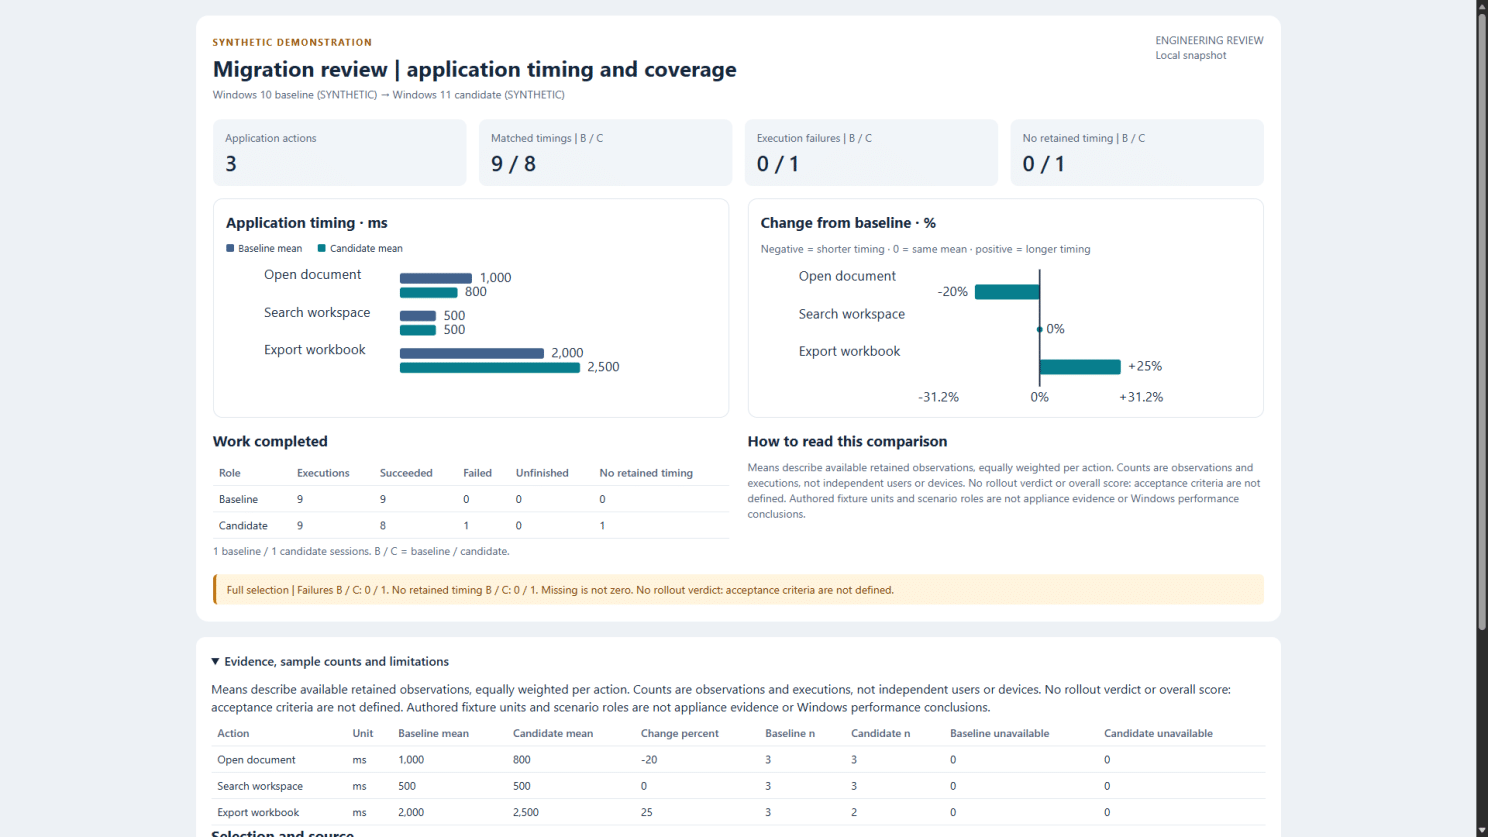
Synthetic example: timing changes appear alongside completed work and failures. The candidate’s missing timing is not treated as zero.
Export has fewer candidate observations because one execution failed without recording a timing. The baseline has nine successful executions. The candidate has eight successful executions and one failure, with nine executions on each side. Each side has one synthetic session, so the timing observations are not independent users or devices.
That failure belongs beside the timing changes. A missing timing is not zero, and the report does not turn these results into an overall migration score or rollout verdict. A real review would need agreed acceptance criteria.
Make the Report Fit the Meeting
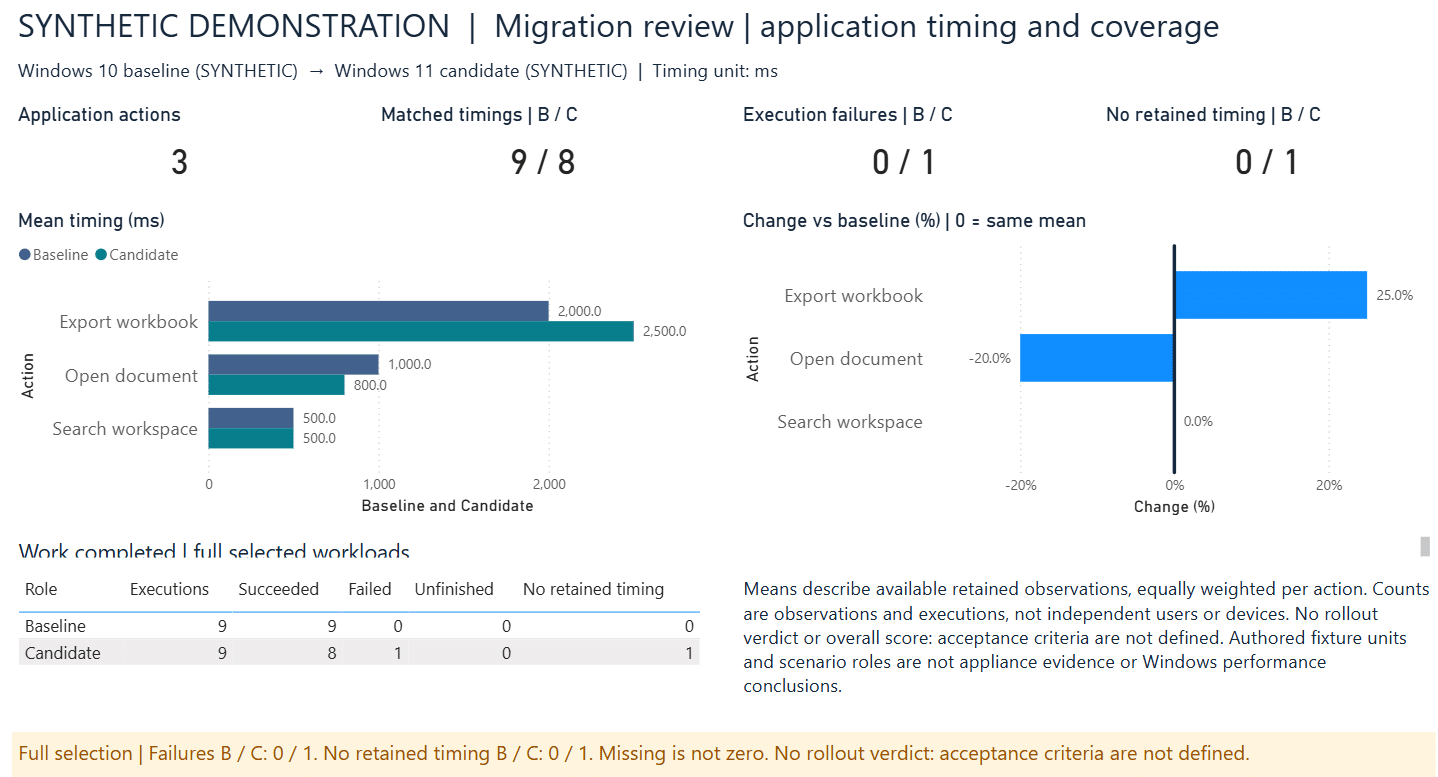
The editable Power BI meeting view uses the same comparison. Per-action sample counts and source detail remain on the Evidence page.
The first report has the detail an engineer needs. Now the request changes:
Make the first page suitable for a migration review meeting. Keep the failure warning visible and move the sample-count detail to the second page with the retained source tables.
The toolkit generates a meeting version from the existing comparison and a revised report specification. The overview keeps the timing charts and workload coverage, including the failure warning. Per-action sample counts move to the Power BI Evidence page and the HTML evidence section. The overview cards still show total matched timings: 9 for the baseline and 8 for the candidate.
The comparison and presentation datasets remain the same across both versions. Reviewers get a shorter first page and can still follow a question back to the underlying observations. Nobody has to assemble a second set of calculations for the meeting.
The review walkthrough includes both report configurations and the commands. Generate each version into a new folder to preserve earlier reports and any Desktop edits.
What Was Checked
I refreshed the refined meeting project in Power BI Desktop and made an edit that survived saving, closing and reopening without errors. A visual check found agreement between HTML and the Power BI Overview and Evidence pages on timings, counts, and failures. That check covers this project.
Separately, a fresh Claude session generated both versions on my configured workstation and checked their files and calculations. Those new projects were not opened in Desktop, and this was not a clean-install test. Claude ran commands and read outputs; the engine calculated the values.
Run It Directly, or Describe the Request to AI
The le-results commands work without AI. Optional skills for Codex and Claude Code help translate a request into explicit selections and report configuration, then run those same commands. Both paths use the Python engine for calculations. PowerShell wrappers are optional.
Power BI is one useful reporting destination when you want to keep editing in Desktop. The self-contained HTML report and JSON/CSV exports also work on their own. This demonstration is a local-file snapshot: refreshing it reads the bundled evidence. A separate refreshable project can retrieve a selection from the appliance through the toolkit’s Power BI connector. An earlier fixed-window project completed two refreshes I observed, then saved and reopened. That establishes retrieval of retained history for that project; new observations, rolling ingestion, and streaming remain unvalidated. Power BI Service and gateway use are also unvalidated.
Try It with Your Reporting Scenario
Start with the offline quickstart’s three-action review. You’ll need Python 3.11 or newer in a user-local environment with the locked dependencies installed. Power BI Desktop is needed only to open and edit the Power BI project. The offline example needs no appliance connection or toolkit connector.
For appliance retrieval, you’ll also need API read permission, a token in your operating system’s credential store, and approved HTTPS trust. Refreshable Power BI adds its own credential setup and native HTTPS trust; the Python setup does not transfer them. The prompt gallery pairs example requests with commands you can run without AI.
Try the synthetic example, then tell me where it fits or where it falls short through product feedback. You can also contact me in the community channel to work through a reporting scenario together. Use synthetic examples and keep customer captures and credentials private.
Stay tuned for more Workspace Weeklies and explore earlier posts in the Workspace Weekly hub.
Workspace Weekly