

Better Inputs for Your Login Enterprise Power BI Reports | Workspace Weekly
October 28, 2026
Comparing Login Enterprise results in Power BI means checking what sits behind the charts. You need the selected period to include the observations you expect, and failed runs need to stay visible even when they produce no measurements.
Customer reporting questions prompted me to review the existing community connector and template. I’ve updated both. Version 1.1.0.2 update gives you a better starting point for those comparisons, with clearer handling of retrieval failures and report values.
Please note: this connector and template are unsupported community tools and are not covered by Login VSI product support.
What Changed in Connector 1.1.0.2
- More complete retrieval: Retrieve measurements beyond the old 1,000-row limit per run per day.
- Clearer date windows: Consistent UTC calendar days make the reporting period explicit.
- Better failure and value visibility: Keep failed runs selectable and distinguish valid zeros from missing data.
- Optional Key credentials: Move the API token out of query parameters through an opt-in migration.
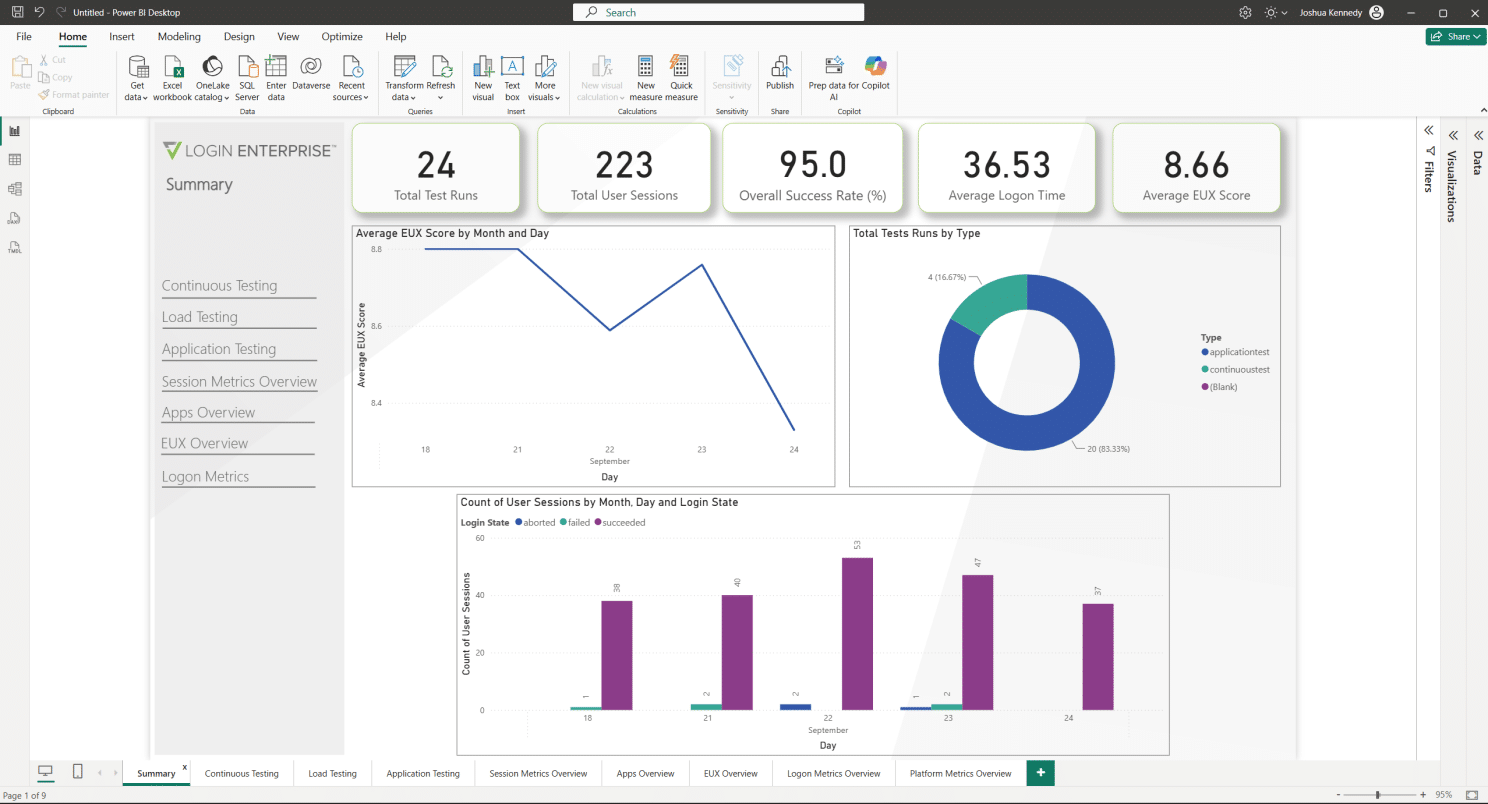
The updated Power BI template brings Login Enterprise run counts, success information, and reporting filters into one overview.
These changes address different parts of the reporting workflow. If your report hit the old measurement cap, a comparison could use only the first portion of the available data. The connector now follows subsequent pages and checks for incomplete responses. Failed requests produce errors with context, and transient failures receive bounded retries.
That makes a retrieval failure easier to distinguish from an empty result. Retrieval still has limits; a selected window containing a broken historical snapshot can fail.
Make Comparisons Easier to Explain: UTC Days and Visible Failures
Date selection now follows UTC calendar days. A fixed Monday-to-Friday window includes the whole of Friday in UTC. Parameter help uses YYYY-MM-DD examples, and incomplete or reversed fixed ranges return an explanation.
For an existing report, this can change refresh behavior. A missing fixed-range date now raises an error instead of silently falling back to 30 days. Platform metrics also use UTC days instead of the previous local-to-UTC conversion. Check the selected period when reconciling with local-time displays.
The revised template keeps failed test runs without measurements selectable in the relevant views. Success rates include finished Application and Load runs even when they produced no measurements. In-progress and Continuous runs are excluded from that denominator.
Valid zero session-metric readings remain visible. Certain gauges stay blank until you select a single run, and two cards previously labelled Active Sessions now say Distinct Accounts. Those distinctions help explain what a number represents.
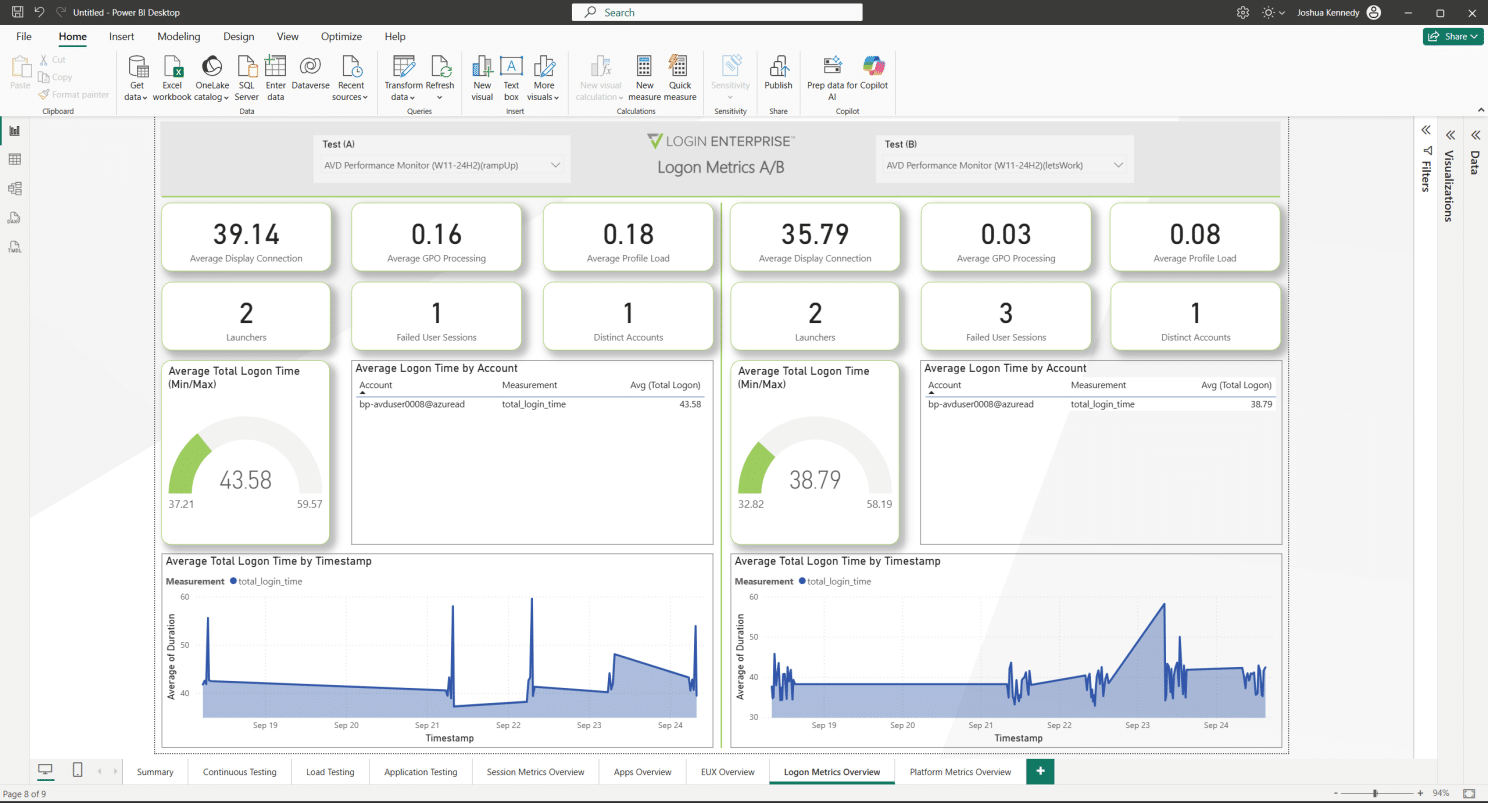
A failed run remains selectable even when it has no measurements. Missing values remain visible as missing data.
EUX averages need the same care: the template’s existing averages are unweighted means of aggregate rows. They are distinct from Login Enterprise’s native overall EUX score.
Start Fresh or Upgrade a Copy of an Existing Report
For a new report, use the recommended connector and template pair.
For an existing report, back up the connector and PBIX, follow the upgrade and rollback guidance, and refresh a copy. Compatibility with an older saved 1.1.0 report has not been established. Replacing the connector does not rewrite your DAX or apply the template changes.
Key authentication is optional. The downloadable PBIT retains the legacy token parameter; use the documented migration to move a report to Power BI’s credential store.
The pair was checked in Power BI Desktop within the recorded validation scope. Gateway/Service scheduling, custom PDF export and incremental ingestion remain future work.
Try It with Your Reporting Question
Follow the setup guide with Power BI Desktop, a read-access API token and appliance access over trusted HTTPS. Custom connector settings must follow your organization’s policies. This Desktop workflow requires no AI, Python or gateway.
For tailored HTML or editable Power BI reporting, the separate Results Toolkit offers optional AI-assisted and direct-command paths. Both projects remain unsupported community tools, outside Login VSI product support.
Try the updated pair and tell me which reporting question it helps you answer. Share product feedback or find me in #workspace-weekly to discuss a scenario.
Explore earlier posts in the Workspace Weekly hub.
Workspace Weekly