

Login Enterprise Results Are In. Here’s How to Tell the Story. | Workspace Weekly
November 11, 2026
“Compare these two Login Enterprise Load runs and give me a report I can send.”
That’s the kind of request I built the Results Toolkit to handle. Choose the runs, retain the evidence, and turn the results into an HTML report, a PDF, or an editable Power BI project. You can describe your request in plain language using the optional AI skills or run the commands directly. The same toolkit does handles retrieval, comparisons and report generation either way.
The first article covered repeatable comparisons. The second showed how to adapt a report for a review meeting. In this final installment, I’m bringing that work together with native scores, PDFs exports, and jobs you can run from your own scheduler.
Show the Scores Login Enterprise Already Calculated
A Load run has its own whole-run End User Experience (EUX) score and VSImax result. The toolkit brings those values and their states into the comparison report alongside the detailed evidence. If you read last week’s Power BI article, the same distinction applies here: a whole-run score and an average of timestamped observations answer different questions.
A missing score stays unavailable, and a genuine zero stays zero. If VSImax is above the threshold, the comparison displays it as a lower bound and leaves the change unavailable. In Power BI, read the display and state fields alongside the numeric value so a raw value isn’t mistaken for an exact capacity.
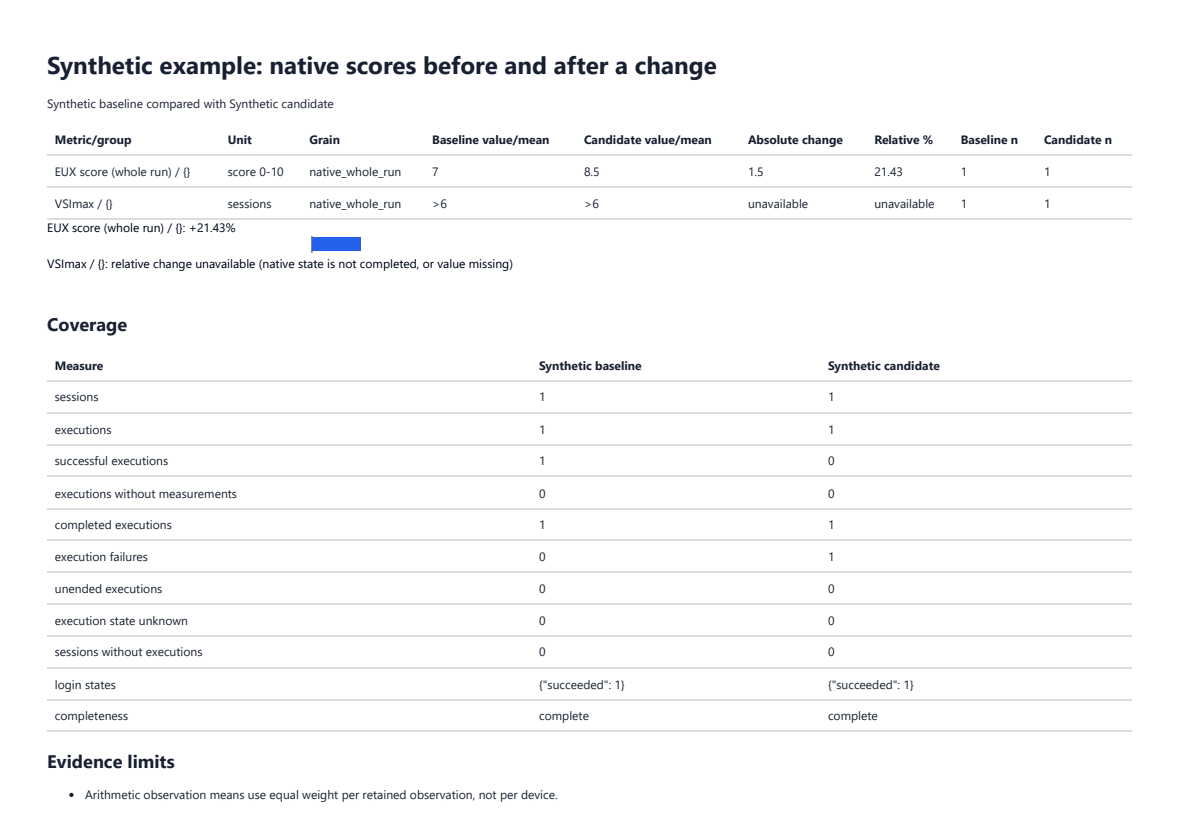
Example: EUX moves from 7 to 8.5, an increase of 1.5 score points. The percentage describes the change in the score. Both VSImax results are above 6, so no capacity change is calculated. The coverage table shows the failure in the candidate run.
What the Native-Score Checks Verified
I checked one EUX-enabled Load run against the product screen and native PDF, and a separate run with EUX disabled run against the API and run fields. I also verified rows, states, bounds, and run identities in a two-run Power BI Desktop copy containing two runs. The native-score notes document those checks.
Send the Same Report as a PDF
Once the HTML report is ready, report-pdf prints it through an installed Edge, Chrome, or Chromium browser. That gives you a shareable copy with the same scores, charts, and evidence. I printed and inspected the report containing synthetic data using Edge on Windows.
The command checks the output before replacing an existing PDF and writes a receipt alongside it. See the PDF guide for setup and verification details.
Repeat the Workflow from Your Own Scheduler
Use le-results job run for one capture and report job, and le-results job status to see the latest attempt, the last successful output, and the age of the source data. A failed job leaves the last good report in place. Running the job again against the same fixed runs reproduces the same evidence, so check the source timestamp when you need newer results.
I generated a PDF from two retained Load runs on a test appliance and separately verified a launch through Windows Task Scheduler. The scheduling guide covers registration, output folders, and recovery.
These jobs generate files on a machine you control. The toolkit also offers snapshot and refreshable Power BI Desktop projects. Power BI Service refresh for this separate toolkit connector remains untested; see the gateway readiness notes for that setup.
Explore Timing Data in Grafana and InfluxDB
If you already use Grafana and InfluxDB 3, the repository includes an example writer, data source, and dashboard for exported timing points. I ran the example locally with synthetic data over authenticated TLS and checked the dashboard results against direct queries. The Grafana example notes explain the setup.
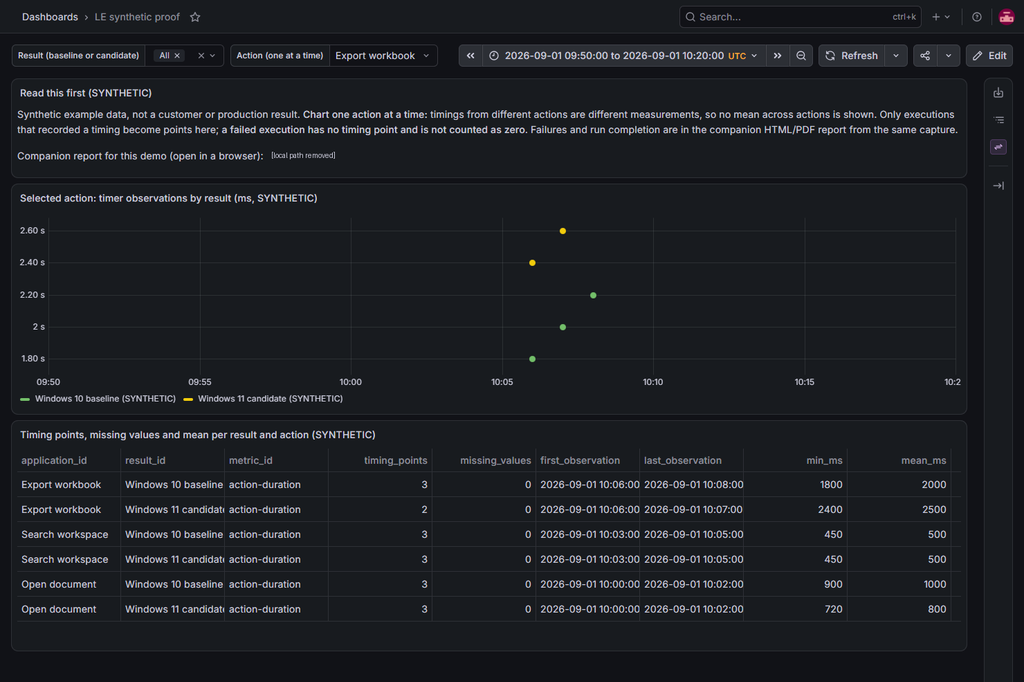
Example: The export workbook contains three baseline timing points and two candidate timing points because one candidate execution failed without recording a timing. The companion report retains the failure context. A local file path was removed from the note.
Try It with a Report You Already Make
Start with the offline quickstart. It uses synthetic results and needs no appliance. Try the commands directly or use the optional natural-language workflows. You can also use the CSV exports in Excel if you want to work with the numbers there.
Tell me which report you need, what decision it should help someone make and where you still have to assemble it by hand. Share a sanitized example through product feedback or #workspace-weekly. You can find earlier posts in the Workspace Weekly series.
The Results Toolkit is a community preview. The screenshots use synthetic data.
Workspace Weekly