

Make Login Enterprise Comparisons Easier to Repeat | Workspace Weekly
October 16, 2026
The test is finished, but the rollout decision still needs a clear comparison. You need to identify the right results, check what was completed, and collect the measurements that explain the change. After the next image update, much of that collection and report assembly starts again.
The audience changes, too. An application owner wants to understand a failed workflow. A migration lead needs to know whether the next group of users can move. Management needs a clear explanation of the findings, with enough context to decide.
I’m addressing that repeated work with the Login Enterprise Results Toolkit.
The toolkit retrieves existing results, retains reusable datasets, compares explicitly selected scenarios and generates reports you can adapt. You can run its commands directly or use optional AI skills to describe the work in natural language.
It is a public, unsupported community preview under active development, rather than a supported Login VSI product.
Build on the Results You Already Have
Login Enterprise already provides result views, comparisons, exports and PDF reporting. For example, its Application Test results let you review measurements and events, compare test instances and download reports.
The toolkit complements those capabilities when you need to repeat a collection process, move data into another analysis tool or build a report around a particular decision.
Its starting point is an existing result. You select the results and, where appropriate, a time window. The toolkit retrieves the available evidence through the Public API and retains the source responses alongside structured tables and a record of the retrieval.
That gives you something reusable when the next question arrives. You can build another view from the captured data without first reconstructing which results the original report used.
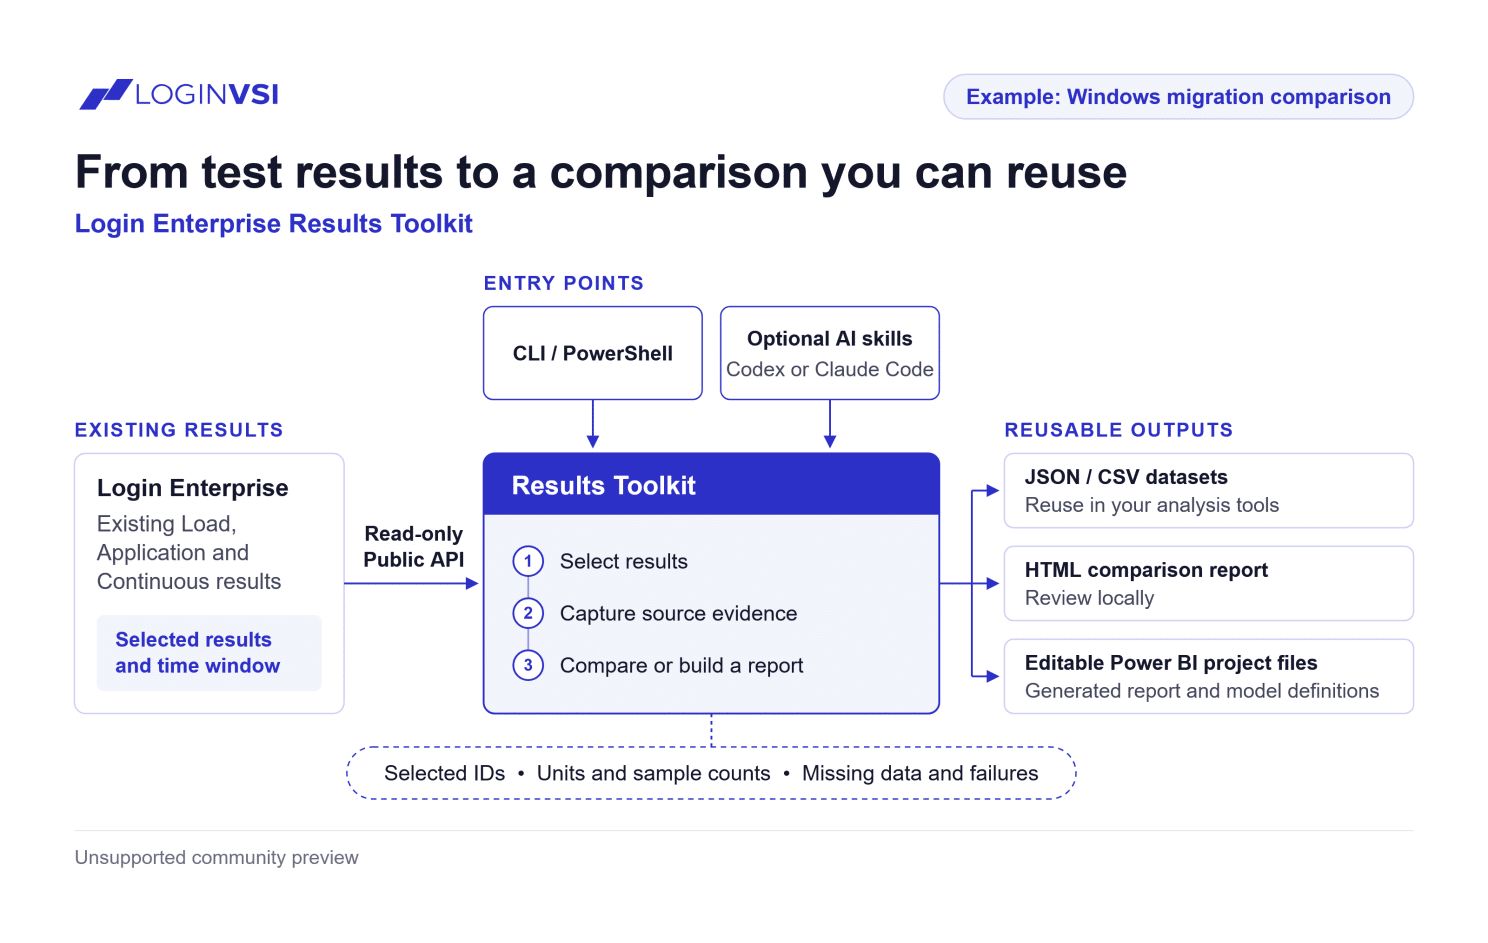
Existing Login Enterprise results feed a repeatable capture, comparison and reporting workflow. Direct commands and optional AI skills use the same toolkit.
A Practical Example: Windows 11 Migration Comparisons
Consider a team preparing its next Windows 11 migration wave. It has Login Enterprise results from a Windows 10 baseline and a Windows 11 candidate image. The question is whether the applications and workflows that group depends on are ready for rollout.
Login Enterprise helps teams assess application behavior, performance, and user experience across those environments. The Windows 11 migration overview describes that broader testing approach.
The toolkit helps organize the evidence after those tests.
The team can select the baseline and candidate results, capture the available measurements, and define which application timings or other measurements belong in the comparison. The selected IDs, units, and sample counts stay with the output.
Comparable conditions are still important. Hardware, application versions, concurrency, workload configuration, and the period being reviewed can all affect the interpretation. A test name containing “Windows 11” does not establish the configuration behind it.
After revising the candidate image, the team can reuse the comparison definition with newly selected results while retaining the earlier captures for reference.
The same pattern applies to a security-agent comparison, an application update or a desktop-image change. The decision changes; the need to preserve the selection and evidence remains.
Keep Failures Beside the Averages
A lower average does not explain what happened on its own.
If one test completed the expected workload and another encountered application failures or unfinished work, the comparison needs to show that difference. Otherwise, a report can make reduced activity look like improved performance.
The toolkit keeps failure evidence and missing measurements visible. Missing data does not become measured zero, and a completed retrieval does not imply that the tested workload succeeded.
The offline quickstart demonstrates this with a clearly labeled synthetic migration example. Its baseline mean is 120 and its candidate mean is 130. One candidate execution failed, and that failure remains alongside the comparison.
Those values demonstrate the reporting workflow. They are not Windows benchmark results or measurements from a customer environment.
The useful outcome is a comparison that someone else can inspect: which results were selected, what was measured, how much evidence was available and what failed.
Run Commands Directly or Describe the Work to AI
The toolkit has a direct command-line interface through le-results, with PowerShell wrappers for Windows users. The documented workflows cover connection checks, result discovery, export, comparison, and report generation.
You can use those workflows without an AI subscription. Teams that cannot use AI can run the commands and adapt the included PowerShell example.
Optional skills provide another way to work with the same functionality in Codex or Claude Code. For example:
Compare these two captures using this metric configuration. Show the sample counts, missing measurements and failed executions, then generate an HTML report.The assistant helps turn the request into explicit configuration and command execution. The toolkit’s Python engine performs the retrieval, validation, and calculations.
You still review the selected results and comparison assumptions. Natural-language interaction makes the workflow easier to express; it does not establish that two test environments are comparable.
The repository includes AI workflow instructions and an example prompt gallery.
Export to Power BI, Excel, and Your Reporting Workflow
JSON and CSV exports let you use the captured evidence in Excel, notebooks, or other reporting tools. An HTML report provides a local view of the comparison and its coverage.
Power BI is one useful example. The toolkit generates editable project files for a snapshot report carrying selected evidence, or a refreshable project defining which results to retrieve again. Power BI Desktop opening and refresh validation remain pending in this preview; generating the files does not establish that runtime behavior.
The aim is to give you reusable data and report definitions you can adapt to your audience, while keeping a path back to the source.
Try It and Tell Me What You Think
Start with the offline quickstart. It uses synthetic data, so you can inspect the workflow before connecting an appliance.
For appliance access, the preview targets the v8-preview Public API and has been exercised with read-only requests against Login Enterprise 6.9.2. You’ll need HTTPS access and a Login Enterprise API token with permission to read the relevant results. The setup instructions cover Python, dependencies, credential enrollment, and connection diagnostics. See the capability matrix for the current validation scope.
Then choose one comparison you already need to make. Capture the existing results, inspect the coverage, and check that you can trace the report back to its evidence.
I’d like to hear what you would use this for, what gets in your way, and what would make it more useful. If you’d like to try it together or talk through a reporting scenario, send me a message here on LinkedIn.
For Login Enterprise product suggestions, share your feedback at feedback.loginvsi.com. You can also join the conversation in #workspace-weekly in the Login VSI customer Slack.
In the next post, I’ll walk through the AI-assisted reporting workflow, using Power BI as one example of what you can build from the results.
Stay tuned for more Workspace Weeklies and explore earlier posts in the Workspace Weekly hub.
Workspace Weekly