

Use the Right EUX Score in Power BI | Workspace Weekly
November 4, 2026
A Power BI card shows 4.2. Login Enterprise reports 3.3 for the same Load run. Which value belongs in your report?
In this retained lab run, 4.2 was the unweighted average of the hourly End User Experience (EUX) buckets loaded into Power BI. The appliance’s native whole-run score was 3.3. Use the native value to report the run’s overall score; use aggregate rows to examine trends over the loaded period.
I’ve updated the community Power BI connector and template to make those reporting choices easier. The summary card shows the appliance’s native whole-run score, the aggregate views retain the trends, and clearer run titles help readers identify exactly what they’re looking at. The 1.2.1.0 update also fixes how measurement rows are associated with their source run.
This is an unsupported community preview, outside Login VSI product support. The results below are limited to the lab checks described here.
A Summary Card and a Trend Chart Need Different Values
For the same retained Load run:
- Native EUX score: 3.3. Login Enterprise’s score for the whole run.
- Aggregate bucket mean: 4.2. The unweighted average of the hourly EUX buckets loaded into the report.
The native score covers the whole run. Changing the report’s date window can change which aggregate buckets are loaded without changing that run’s native score.
The connector retrieves the native result from the Load overview endpoint. It does not recreate the EUX scoring formula. Like the connector’s other routes, this request uses v7-preview. The native-score notes explain the sources and date-window implications.
The EUX Score Card Goes Native, the Gauges Stay Aggregate
The Load Testing page’s EUX Score card uses the native result. Its title identifies the selected run and start time, so a screenshot carries more context than a number alone.
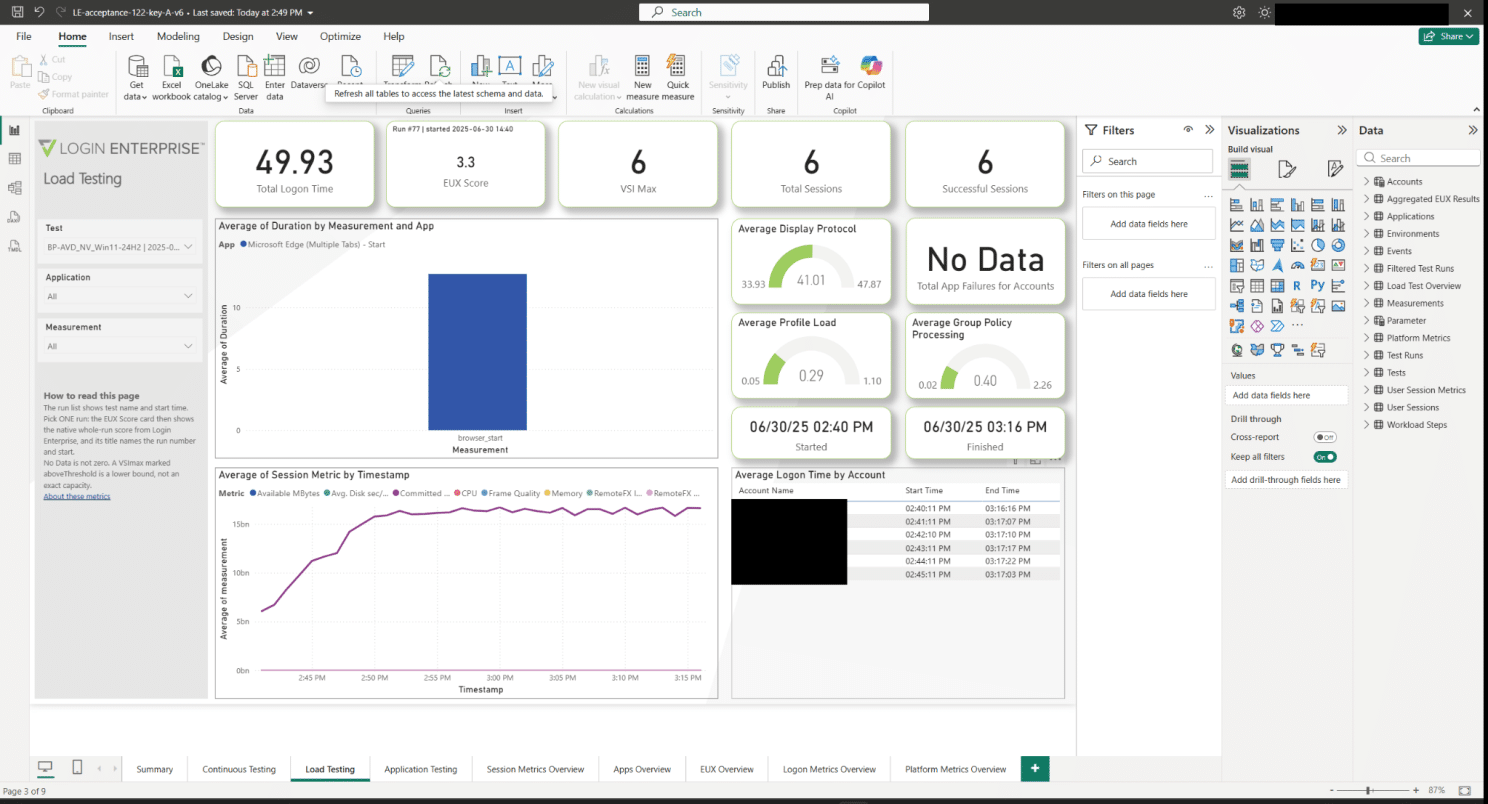
Retained lab data: the selected Load run’s native EUX score is 3.3. This is one run, not an average across selected runs.
The card prompts you to select one run unless exactly one is selected. An overview row without a score displays “No Data”; an absent overview row displays “No overview”. Native Load overviews are available only for Load runs; Application and Continuous runs have no overview row.
The EUX Overview gauges still use aggregate rows. Their titles say “Aggregate EUX Buckets (Avg, Min/Max)”. Keep those views for the aggregate context alongside your whole-run summary.
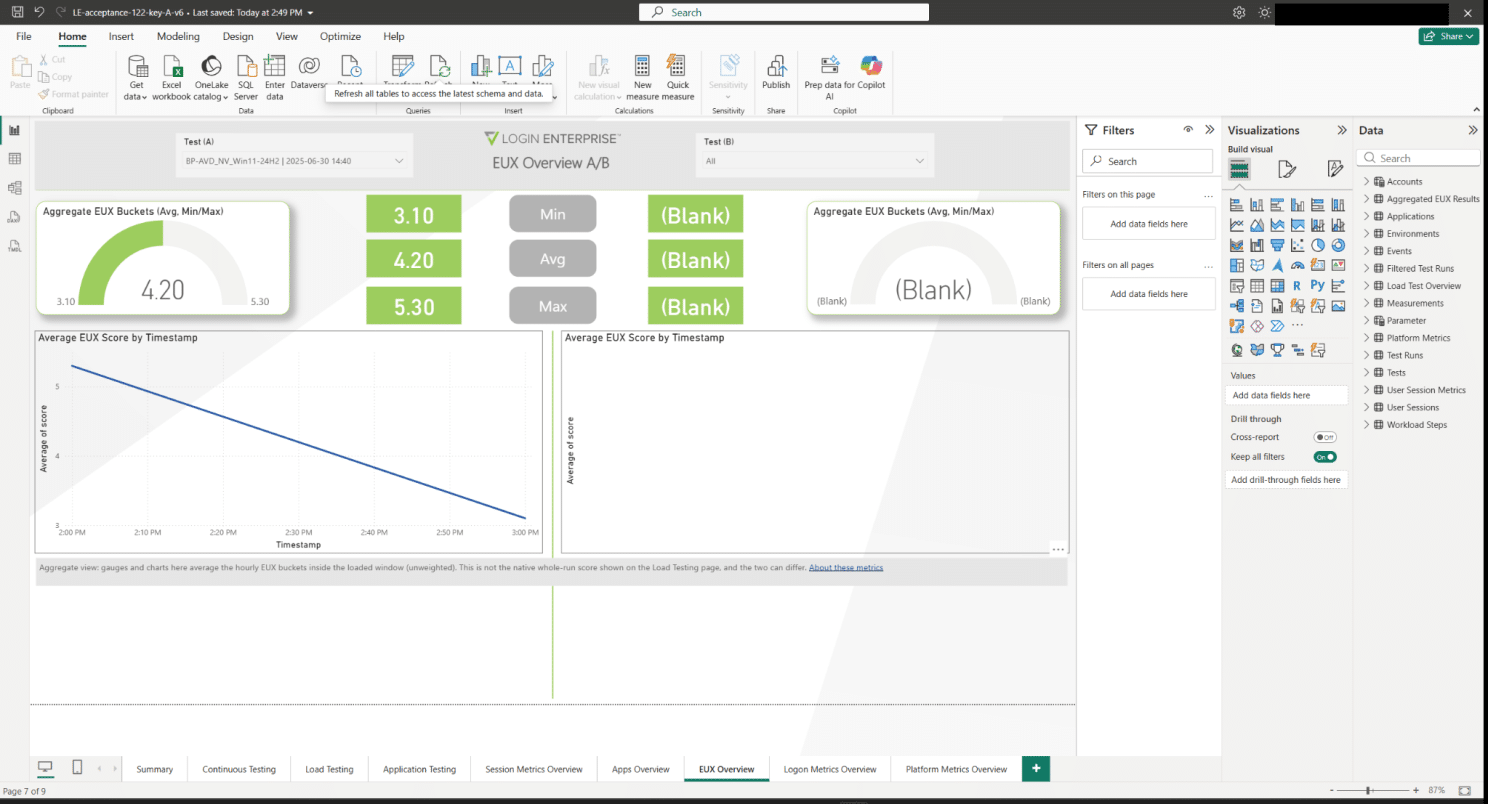
The same retained run’s loaded aggregate buckets average 4.2. Side B stays blank until a run is selected there separately.
The metrics guide describes the tables, units, states, and reporting grain behind these views.
Gateway Refresh: Update Published Reports Without Opening Desktop
For a report published to Power BI Service, this custom connector uses Microsoft’s standard on-premises data gateway to reach the appliance. The connector must be installed where the gateway service can read it, with a connection configured in the Service. Ordinary Desktop use needs no gateway.
The gateway path I tested used a Key-credential connection in the Service. The downloadable template retains the legacy token parameter, so follow the Key migration guide on a report copy before following that tested gateway setup.
What the Gateway Checks Verified
I tested the updated workflow in Desktop and through the gateway into Power BI Service. All seven retained Load runs matched the source in both places, including the native 3.3 score shown above.
I also verified that new session records and timeout-event records for Continuous tests reached the published Power BI report through both on-demand and scheduled gateway refresh.
The practical benefit is a published report that can refresh without someone opening Desktop each time. That gives teams a useful way to keep shared reporting current and bring newly collected records into their existing Power BI workflow. Keep the gateway host on, awake, and connected, and check the latest source timestamp alongside the refresh status.
The gateway guide and acceptance record retain the results and findings.
Try the Updated Connector and Template on a Copy
Start with the current connector and template downloads: connector 1.2.1.0 and Login Enterprise 1.2.1.0-candidate.pbit. Keep a backup of your PBIX and connector, then work on a report copy.
Replacing the connector does not rewrite an existing report’s DAX or apply newer template visuals. Use the template as a starting point, or follow the native-score notes to add the overview table and measures to your own report.
The downloadable Power BI template (PBIT) retains the legacy token parameter. To keep the token out of query parameters, follow the documented Key migration on a separate copy. The recorded 1.2.1.0 Desktop checks used a Key copy.
Select the same completed Load run in Login Enterprise and Power BI, and then check the native value, state, and aggregate view separately. You can keep the familiar trend report while making the summary card easier to explain.
Want to turn the same reporting question into a tailored HTML report, PDF or editable Power BI project? The separate Results Toolkit provides another way to retrieve the evidence and build the output, using optional AI skills or direct commands.
Try the pair with a reporting question you’re working on. Tell me what helps and what’s still missing through product feedback or the Workspace Weekly community channel. Share sanitized examples, and find the rest of the series in Workspace Weekly.
Workspace Weekly