

How to Objectively Benchmark the End User Experience to Improve the Employee Experience
May 24, 2022
Employee success and workplace technology are inextricably linked. It’s for this reason that Digital Employee Experience (DEX) is gaining the attention of organizations everywhere as an important aspect of overall employee satisfaction and retention. At its core, DEX is concerned with the quality of user interactions with technology in their work environment.
There are numerous technologies in the market today that offer capabilities to benchmark various aspects of end user experience. DEX solutions aggregate data about the performance and usage of workspace tools along with context-sensitive sentiment data into a holistic experience score. While working in tandem with DEX, Digital Experience Monitoring (DEM) tools gather analytics to determine whether the technology experience is good or bad.
While these solutions offer valuable insight into employees’ current experiences, help IT staff catch and remediate issues, and guide future technology choices, there’s one fundamental challenge: these tools only evaluate experience once everything is in production. This leaves a significant within IT between the implementation of new technology and updates during evaluation and pre-production cycles and the time when everything is rolled out to the employee population.
A practical IT view of the end user experience
“Experience” is inherently subjective. How do you quantify something that every user has an opinion on? How do you best balance decisions between budget constraints and sophistication? How can you compare two environments and ensure you’re not making matters more complicated? What might be the implications of moving to the cloud?
When designing a new digital workspace environment or making changes to existing ones it’s important to keep an eye on performance and overall experience. We all know the feeling when switching to a new device—it feels fast and responsive. Fast-forward two years and it has become a lot slower. But this is typically subjective feedback impacted by a lot of external factors—even the weather or a traffic jam might have an influence.
In response, Login VSI developed the EUX Score to help IT teams bridge this gap. EUX Score can be used in evaluation, pre-production, and production environments to build consistent, objective baselines across the digital workspace lifecycle. EUX score provides a mechanism that gives you repeatable, consistent, and scientific results.
A benchmark for all seasons
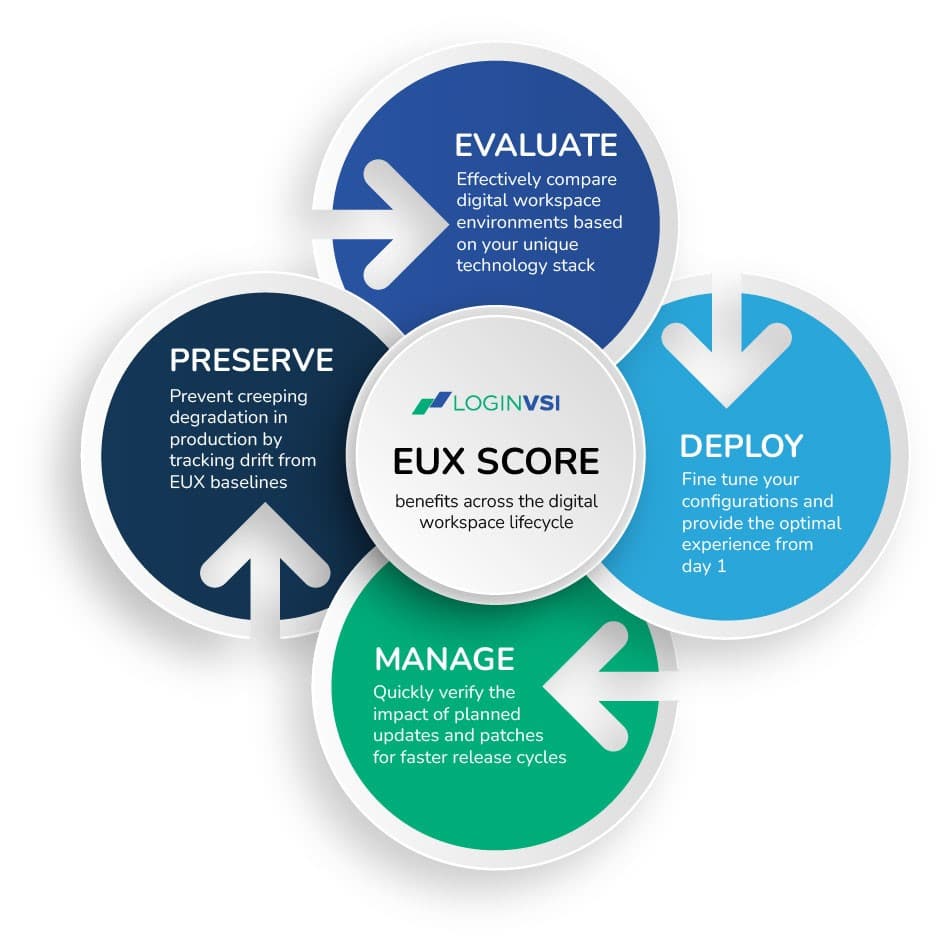
Let’s take a look at how this could apply within all the phases of the digital workspace lifecycle.
Effectively evaluate digital workspace environments based on your unique technology stack.
Technology evaluations become easier with a reproducible set of metrics. Now you can choose the best combination of VDI/DaaS platforms, cloud providers, and supporting hardware and software based on comparable data.
Fine-tune configurations before rollout to provide the optimal experience from day one.
Configuration parameters, the layering of security and monitoring tools, business-critical applications and more, create a complex web of settings that can be quickly tested to determine the optimal mix for the best outcomes.
Quickly verify the impact of planned updates and patches for faster release cycles.
Rapid testing of planned change sets can quickly determine the impact on experience and performance, meaning you can shorten your change windows. Security teams and application owners benefit from better protection and getting much-needed features in the hands of end users faster.
Continuous monitoring in production to detect creeping degradation.
Once your benchmark is established, ongoing tests in production quickly identify when the experience falls below your initial benchmarks. Finding and fixing issues before users notice is that much easier.
The starting point for the EUX Score
The EUX score is calculated from several actions that reflect typical user operations correlating well with real experiences while working on the system. These actions allow us to measure the following types of operations:
- Launching applications (time and success)
- Keyboard input response (sticky keys)
- CPU-related actions
- Disk/IO-related actions
- Any combination of the above
But relying on performance metrics alone doesn’t create a workable EUX Score. The next step is incorporating some of the human input upon which the model was formed.
EUX Score: Built for humans
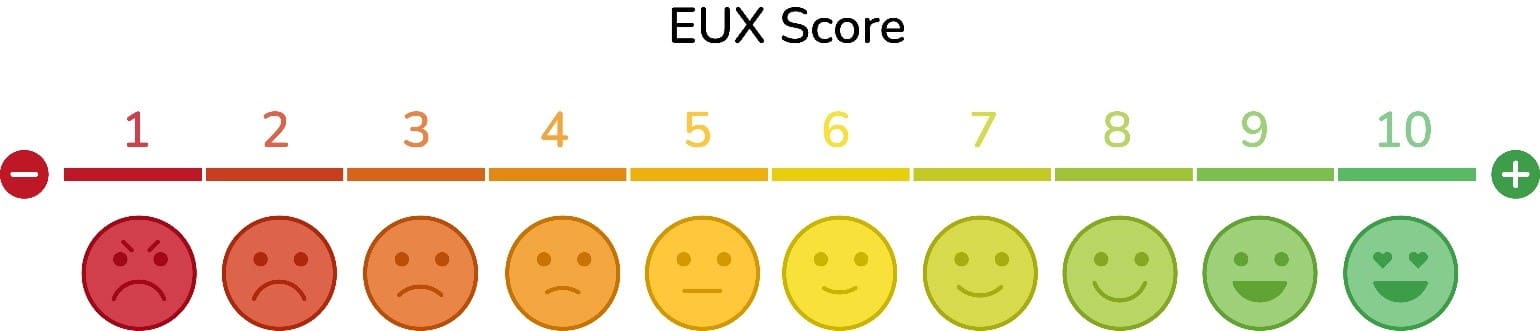
While the whole point is to remove as much subjectivity as possible, the EUX score needs human input to train its algorithms. To build baselines, we let real users perform a fixed set of operations on various digital workspaces. Everyone was then asked to provide a score between 0 to 10 based on their experience.
In tandem, simulated users gathered performance metrics based on the same fixed set of operations. As we modeled varying performance characteristics, our developers were able to evaluate computed scores with the human-assigned score.
Not surprisingly, we found that using the average response times reported by the performance metrics did not accurately reflect how real users reported their experience. Over thousands of tests, the algorithm was adjusted to weight specific factors, such as a subset of response times or a number of application failures, to generate a calculation that blended performance and experience.
There is no “Perfect 10!”
Any time humans are involved – either during input or output—there will be no such thing as perfection. The same can be said of our EUX Score. The balance and weighting of the score are not designed to achieve perfection, so don’t be surprised if your first test reveals a score around the center point on the scale.
The ultimate goal of the EUX score is not about achieving perfection, but rather providing a baseline from which teams should seek to improve.
A practical example of the EUX Score
An organization launched a project to refresh systems used for a group of users. The traditional evaluation strategy relied on guidelines from manufacturers.
The challenge is that vendor guidance doesn’t factor in the end user’s typical business processes or the entire technology ecosystem each user is working within. Such “myopic” guidance often leads to performance issues for real users during production meaning that issues occur only after selections have been made and that any needed modifications are inherently reactive vs. proactive, meaning potential downtime, unanticipated costs and additional time constraints on IT staff.
With the EUX Score, the organization finally had a reliable way to take both into account. A quick evaluation revealed the expected experience using a reproducible set of tests. The process helped them identify the best candidates, which were aligned with budgetary constraints to reach the best decision.
The chart below provides an illustrative example. The chart shows the EUX Score of five different environments. It isn’t showing that a Dell OptiPlex is a poor-performing system; however, in this scenario, the environment/application mix generated a user experience score lower than the others.
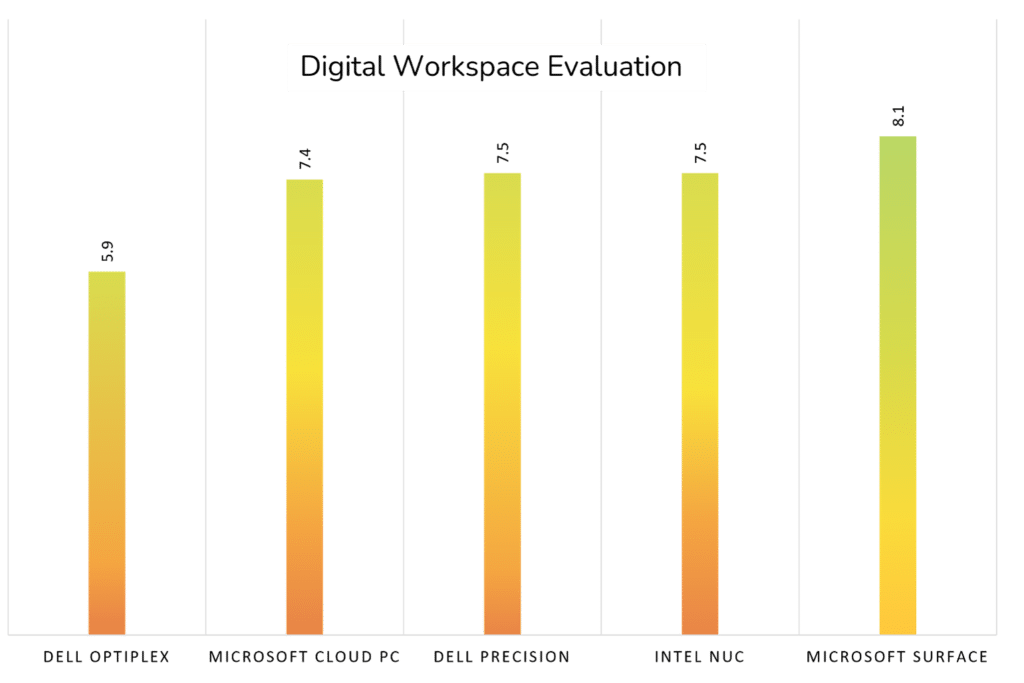
This analysis becomes an incredibly powerful tool, especially in user populations with heavy computing needs or working in hybrid scenarios where users blend an office and work-from-home model. EUX Score is yet another tool in your arsenal to make smarter decisions for your wallet and your employees.
An ounce of performance goes a long way
In a poll of 2,000 people over age 18 conducted by OnePoll in June 2021 on behalf of LG Electronics, employees make their disdain for IT-mandated PCs clear. Fifty-eight percent call them “awful to work on” and 62 percent say the computers prevent work from getting done. Seventy-one percent know they’d be happier in their jobs with better tech.
You may not be scoring a perfect 10—and frankly, it’s doubtful an employee would ever rate that high—but even incremental improvements can go a long way in elevating the employee experience.
Wait a second…what happened to VSImax?
VSImax is considered the industry standard when it comes to measuring user experience and capacity planning in VDI environments. This year we released an updated benchmark, VSImax2, that extends the capabilities for single-user devices and cloud environments. The bottom line is that VSImax is available as a new and improved version within the Login Enterprise Platform.
While VSImax2 still defines the tipping point of your digital workspace environment, what is different is the underlying algorithms and incorporation of EUX Score to benchmark for today’s changing technology characteristics. If you go beyond the VSImax2, the user experience will start to degrade significantly.
The VSImax2 score is now calculated in two steps. The first step determines the threshold from which to compare to EUX as it changes over time. The second step determines the number of sessions running when we crossed the threshold. EUX Score is a critical element of the first step and builds the baseline when the system being tested is running with no load.
We’ll cover more ground on the evolution of VSImax in a future blog.
Ready to start your EUX improvement journey?
If you’re ready to see how the EUX Score and Login Enterprise can help you improve your EUX, request a demo or contact us for more information.
VSImax

