Login Enterprise 5.14: Compare Up to 5 Application Tests
November 25, 2024
We are excited to announce the ability to compare up to five Application Tests simultaneously! This powerful feature provides deeper insights into application performance across different configurations and updates. Whether you’re conducting iterative testing on base images, rolling out Windows updates, evaluating the impact of security agents, or installing and updating applications, this enhancement streamlines your decision-making process. Providing percentage and time differences between the compared tests and recording the success of logins and application executions ensures that the end-user experience remains fast, robust, and efficient.
Key Benefits and Use Cases
Assess Incremental Changes and Catch Issues Early
It’s essential to understand the impact on performance and functionality when updating or installing applications, applying Windows updates, or modifying security agents. With the ability to compare multiple Application Test results, you can:
- Visualize performance changes side by side, including login and application execution times across different tests.
- Identify trends and anomalies: spot performance improvements or regressions and detect critical issues such as failed logins or malfunctioning workflows.
- Make informed decisions based on objective data: ensure changes don’t negatively affect the end-user experience before deployment.
This proactive approach is invaluable for virtual desktop environments and physical endpoints like laptops or desktops. By comparing results from test runs, you can pinpoint precisely where an issue occurred between tests, facilitating swift investigation and resolution.
Evaluate the Impact of Updates and Configurations
Security patches, application installations, and system updates can affect performance and functionality. The comparison feature allows you to:
- Assess how new software or updates impact application responsiveness and login performance.
- Balance performance and security: find configurations that maintain security without degrading user experience.
- Optimize base images: through iterative testing, identify the most efficient setup before deployment.
By ensuring that changes do not negatively affect performance, you maintain a seamless experience for end-users.

Figure 1: Comparison of application performance with various updates and configurations.
Getting Started with Application Test Comparison
Selecting Application Tests to Compare
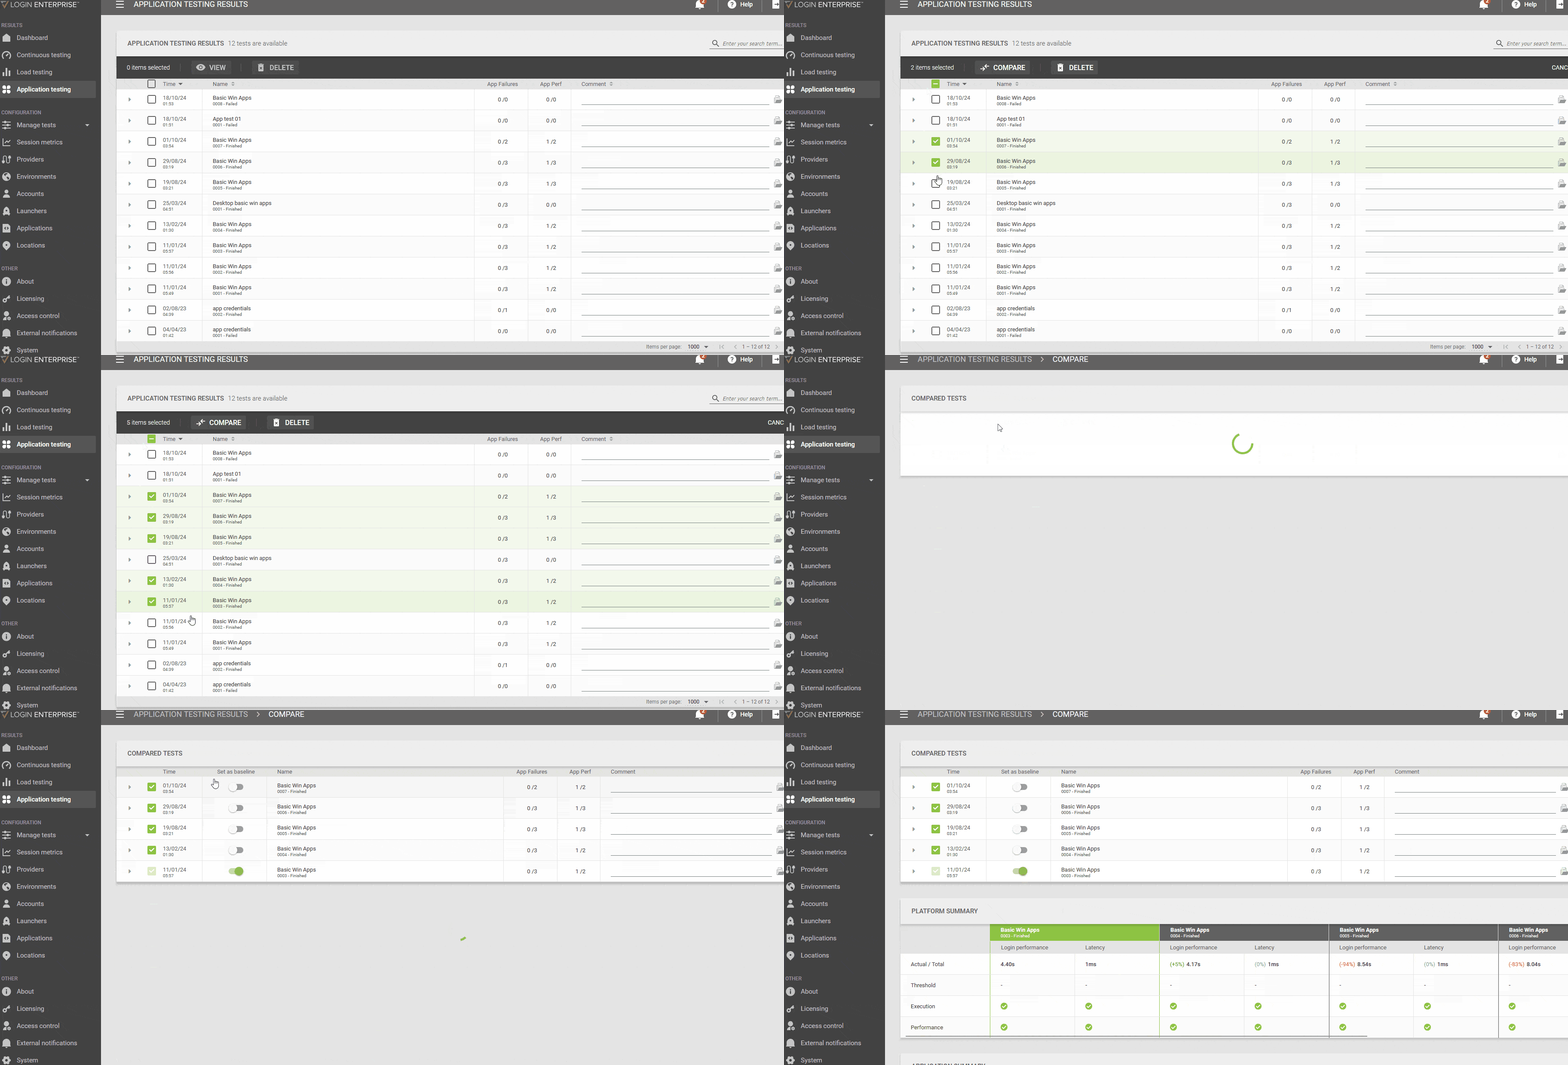
- Access your Application Tests: Navigate to your list of completed Application Tests.
- Choose up to five tests: Use the checkboxes to select the Application Test results you wish to compare.
- Initiate comparison: Click the “Compare” button on the comparison overview page.

Figure 2: Selecting multiple Application Tests for comparison.
Designating a Baseline Test
On the comparison overview page:
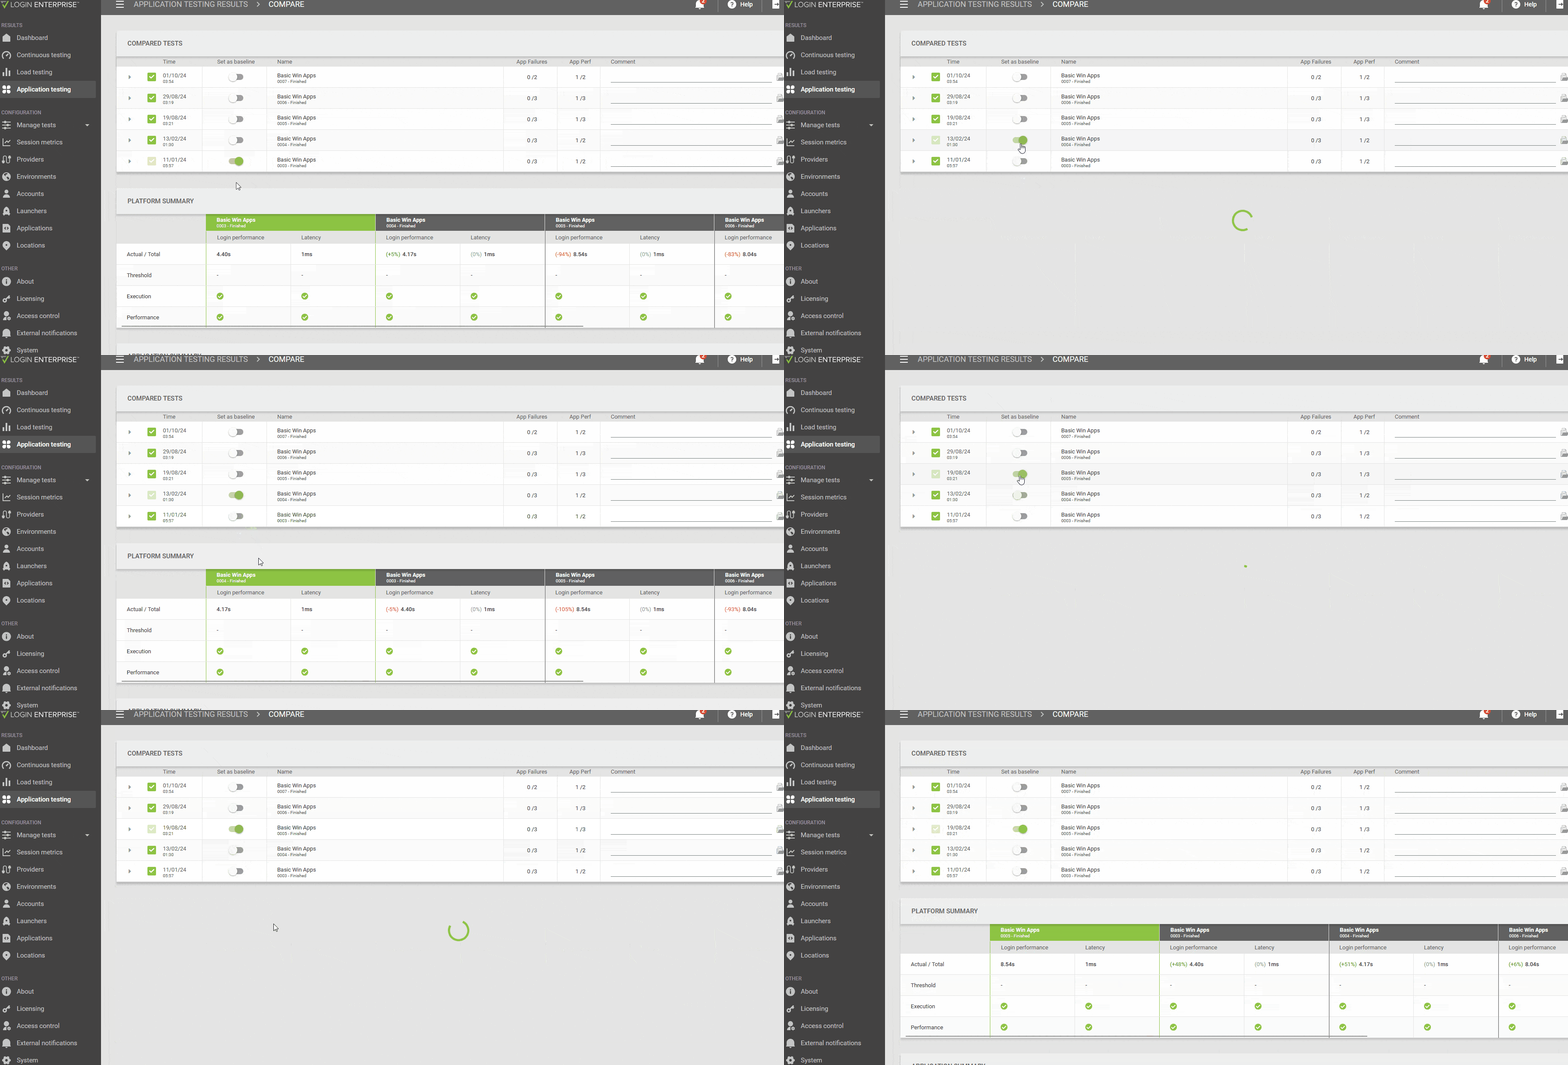
- Set a baseline: Choose one of the selected tests as the baseline. This test is the reference point against which all other tests are compared. You can choose any test as the baseline, tailoring the comparison to your needs.
- Add or remove tests: Use the checkboxes to dynamically add or remove Application Tests from the comparison.

Figure 3: Set a test as the baseline and manage tests in the comparison.
Interpreting the Comparison Results
The results are divided into two main sections, like a single Application Test:
Platform Summary
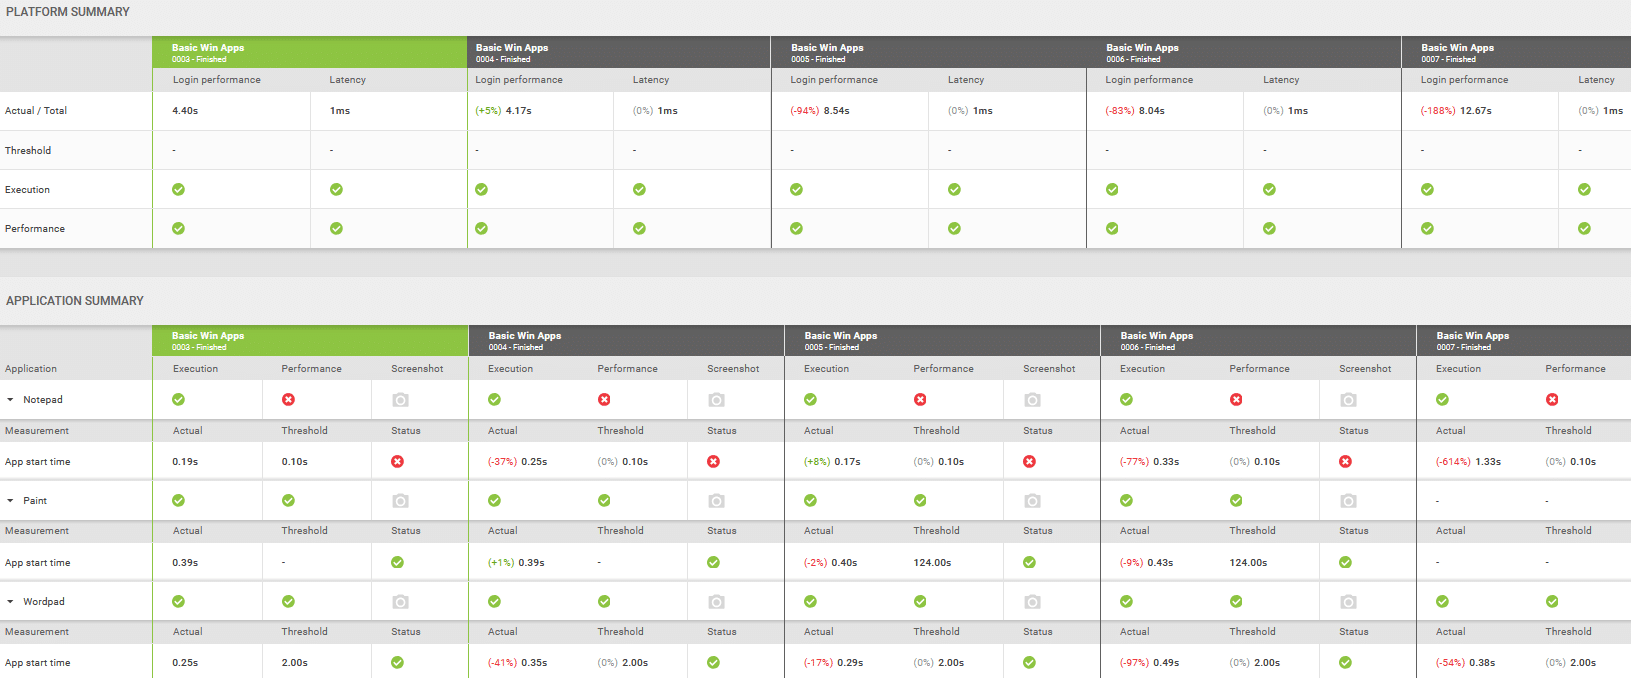
This section displays each test’s login time, latency, and percentage difference compared to the baseline. You can determine if login times exceeded defined thresholds and see how they deviated from the baseline.

Figure 4: Platform summary table showing login times, latency, and percentage differences.
Application Summary
This section compares the results of the Application scripts, including:
- Application execution times with precise timing measurements across tests.
- Percentage and time differences compared to the baseline.
- The application’s success and user login execution are identified by pass or fail icons.
- All defined timers were measured during the tests for granular insights.

Figure 5: Application summary table with execution times, percentage differences, and pass/fail indicators.
User-Friendly Indicators
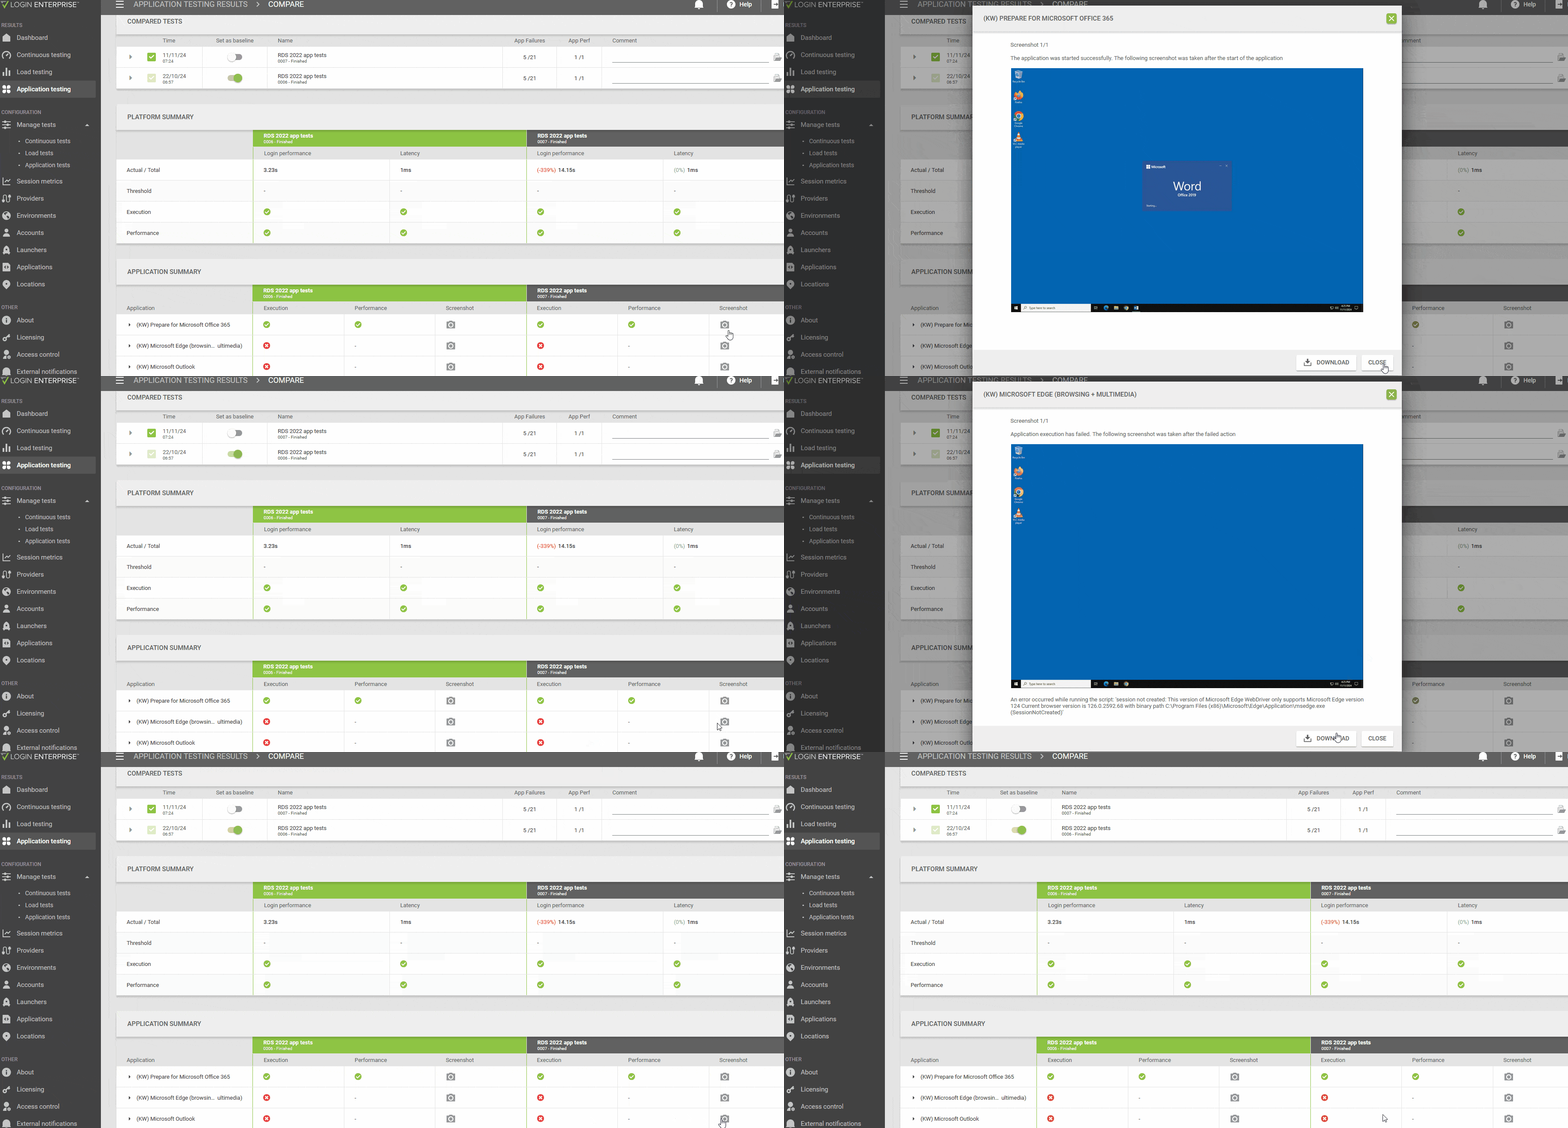
The comparison tables feature pass/fail icons that offer immediate insight into the success of logins and application executions. By accessing per-test screenshots, you can visually confirm application launches and performance. The baseline test column remains pinned for easy reference as you scroll through the results.

Figure 6: Comparison table featuring pass/fail icons and screenshot thumbnails.
Enhancing Decision-Making
By providing percentage and time differences between the compared tests, along with recording the success of logins and application executions, this feature makes complex data easy to digest. You can make objective decisions, ensure readiness for deployment, and identify issues promptly before they affect your entire organization.

Figure 7: Comparison table highlighting performance differences, key insights, decision-making points, and execution statuses across tests.
Best Practices for Effective Comparison
- Compare across environments: Evaluate changes in both virtual desktop environments and physical endpoints like laptops or desktops to ensure consistency.
- Use descriptive names and comments: Clearly label tests with details about configurations or changes for easy identification.
- Perform regular testing: Conduct Application Tests after each change to build a comprehensive performance history.
- Change one variable at a time: Modify only one thing between tests to identify the cause of performance differences accurately.
- Utilize visual aids: Leverage screenshots and precise indicators to understand application performance fully.
Conclusion
The ability to compare up to five Application Tests simultaneously in Login Enterprise represents a significant advancement in performance analysis and optimization. By providing percentage and time differences between the compared tests, recording the success of logins and application executions, and offering easy-to-interpret comparisons, this feature empowers you to make data-driven decisions that enhance end-user experience and operational efficiency.
Take advantage of this powerful new feature in Login Enterprise 5.14 and elevate your image testing to the next level – try Login Enterprise for free.
For more detailed instructions and information, please refer to our documentation comparing Application Tests here.
Login Enterprise Release

