

Login VSI Script Recorder and Microsoft Excel
May 22, 2024
Our Script Recorder enables our customers to effortlessly capture their actions within an application, transforming them into Login Enterprise workload formats in moments. Designed to be user-friendly with minimal coding required, this tool empowers you to effortlessly automate testing for any Windows or web application. Imagine comprehensive testing across all applications within a Windows build in mere minutes, generating detailed reports on functionality and performance.
From logging in to launching applications and validating site functionality, Script Recorder enables engineers to develop custom tests swiftly, tailored to their applications and images. In this article, we delve into how quick and easy it can be to create Microsoft Excel workloads. See the process of using Script Recorder here.
The Top Benefits for Customers Using Script Recorder
The new Script Recorder is incredibly user-friendly, allowing even application owners to create scripts effortlessly. With a significantly reduced time to develop workloads, users can quickly move on to valuable testing against target applications. For example, if making a workload used to take an hour and the Script Recorder reduced this time to just 10 minutes, this would enable the creation of six workloads per hour. In this example, this efficiency means users can develop functioning workloads for six different applications in the same timeframe.
Many of our customers face a backlog of hundreds of applications needing scripts, but they lack the time and resources to address them. The Script Recorder helps them clear this backlog faster by streamlining the scripting process.
Humans naturally think and work more efficiently when actions are continuous. The Script Recorder aligns with this by seamlessly capturing interactions with the target application without the interruption of recording line by line. This continuous recording makes the process more intuitive and user-friendly.
Additionally, the Script Recorder reduces the need for extensive coding. Since it can handle workload creation in a single recording session, users can achieve results with much less manual input, moving us closer to a low/no-code model. This accessibility means that even users without a scripting or programming background can easily create scripts.
Overall, the barrier to entry for leveraging the total value of our Login Enterprise platform is low, making it faster and more robust for users to start or enhance their workload scripting capabilities.
The Script Recorder continuously records user actions, such as clicks and typing within an application, until stopped. This method is far more efficient than writing and copying workloads line by line into the script.
Excel Power Pivot workload
This video demonstrates creating a Power Pivot chart in Microsoft Excel using the Script Recorder. After determining the necessary steps, the workload took just 1 minute and 5 seconds to complete with the Script Recorder. See this video highlighting scripting capabilities not only for Microsoft Excel but also for the Power Pivot Add-in.
After recording the workload, I added Wait functions to simulate a realistic user pace. I then played back the workload to ensure all steps were captured accurately.
The 6-minute video recording demonstrates the following steps: creating a new workload template with the Script Editor, opening the Script Recorder and Excel to record the steps, adding Wait functions, and running the workload to verify that it executes correctly in Excel.
This workload is now prepared for upload to the Login Enterprise appliance for validation and load testing. This workload is designed for anyone using Login Enterprise. To get started, please refer to the workload readme.
The workload (GitHub link):
- Opens Excel and the sample file.
- Creates a new Power Pivot chart.
- Selects datasets from the sample file to add to the Power Pivot chart, generating a graph.
- Zooms into the chart.
- Closes Excel without saving.
Excel Chart and Graphing workload
This advanced workload is designed to simulate user activity while testing Excel’s features, performance, and availability. The actions within the workload were entirely generated using the Login Enterprise Script Recorder. Check out this video that demonstrates the workload in action and highlights its key components.
Before deploying the workload to Login Enterprise appliances, initial tests on a sample target using the Script Editor are recommended. This ensures that no further modifications are required. To get started, please refer to the workload’s readme.
This workload (GitHub link):
- Opens a sample Microsoft dataset. A timer is around how long it takes to open the file.
- Sorts the dataset and scrolls around within it.
- Creates a chart from the example dataset.
- Creates and inserts five 3D graphs based on the sample dataset, zooming into the graphs.
- Saves the file as a new file. A timer is around how long it takes to save the file.
Best Practices
- Utilize Application Xray as a dynamic tool to enhance your scriptwriting experience. Discover how it can elevate your scripts.
- Take the time to manually navigate the target application multiple times to establish the desired workflow.
- Document the identified workflow on paper or a word processor for reference.
- Use the Script Recorder to capture your actions, following the outlined workflow on paper or in a Word document. This ensures minimal adjustments are needed during recording.
- Occasionally, a situation may arise where the Script Recorder continues recording successfully after a file is opened in the target application, such as Excel. This behavior can lead to the loss of window handle visibility within the Login Enterprise target engine, which operates the workload.
Since opening a new file mirrors a typical user’s seamless experience, it may not be immediately apparent that this is the issue. A symptom indicating this problem during testing is the successful recording of the workload, but the playback fails when it reaches the point of opening a file in Excel.
One level deeper of an explanation of this is shown in this PowerShell output:
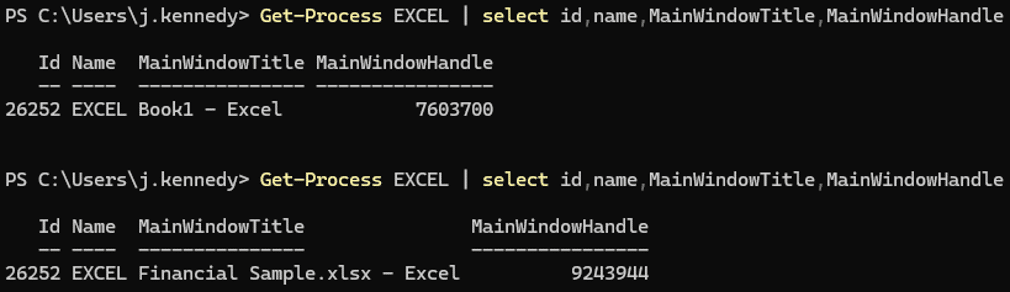
As you can see, there’s a new window handle for the Excel window once it opens a file.
*The way around this is shown in the Excel Chart and Graphing workload.
Note the line that mentions
var MainWindow2 = FindWindow(title : “Sample.xlsx” …
Here, I had to define a new window variable for the new window handle and, thereafter, use the MainWindow2 window variable to interact with the opened Excel document.