Login Enterprise Release 5.1 is Now Available
May 9, 2023
In this release, we find the addition of EUX Timers for capacity testing and performance monitoring and some new insights about user experience in different phases of a pre-production capacity test or the user experience in production.
EUX Component Timers and a first step towards Root Cause Analysis
While the Login Enterprise EUX Score is a great way to simplify measuring end-user experience, when things start to go wrong, it’s beneficial to have visibility into what might be causing that issue. Using the EUX score can save hours trying to track down the issue, especially if the users experiencing the problem don’t know why their systems are slow.
The EUX Score comprises multiple EUX timers that are indexed and weighted to provide a single score between 1 and 10. These EUX timers are also calculated to show up as a score between 1 and 10; this way, you do not have to know how much CPU percentage is being used, how many milliseconds it takes for an application to respond, or how many milliseconds it takes the VDI storage platform to execute an I/O operation. It’s hard to know if those performance counters are good or bad too.
Shouldn’t good or bad performance be something your end-users have a say in?
Let’s say you’ve been monitoring your VDI solution with Login Enterprise, and you notice the EUX Score is starting to drop. This indicates that the end-user experience is slowing down for your users. While it hasn’t gotten bad yet, it is a matter of time before helpdesk tickets start to roll in.
After looking deeper into your EUX timers, you notice that your “My Documents I/O Score” is starting to drop rapidly. When you call your storage admin, who is responsible for the users’ roaming profiles, they notice almost no room left on the network storage device. So the storage admin adds more disks or expands the storage capacity, and within an hour, you notice the “My Documents I/O score” going back up. Wow… that was easy.
Getting closer to a problem’s root cause can save an enterprise from an outage or lost productivity, as remediation is much more rapid. EUX Timers enable this quick response and go beyond monitoring your shared profile folders—they also look at your processing power, application responsiveness, and lag of the workspace itself.

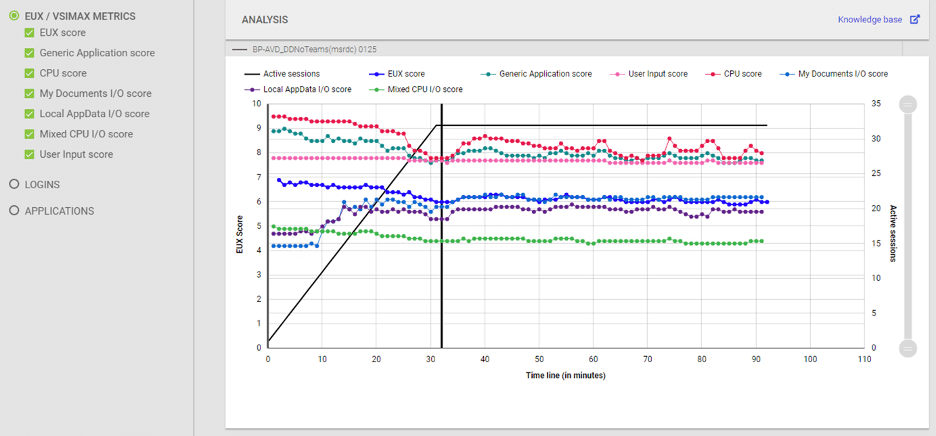
Figure 1: A look at the individual EUX timers in a capacity test

Figure 2: A look at the individual EUX timers in a continuous performance monitoring test.
Steady State and Baseline Scoring
While it is essential to understand the impact a login storm can have on your VDI systems, baseline and steady-state scoring is also critical.
In Login Enterprise, a baseline score is the best possible score your VDI system can provide. The best score generally happens when there are only a few users on the VDI system, and plenty of the compute resources are available. This score can be beneficial in determining how fast your system can go. I like to give my users a steady state experience as close to the baseline as possible.
The steady-state EUX Score represents the performance users get at maximum concurrency after the login storm has passed. For some customers, the steady state score may be what they base the total capacity of their VDI system on because it is what their production users would experience most of their day.
Getting the baseline score as feasibly close to the steady state score is a good goal, but this choice may be more expensive when it comes to cost. Nevertheless, this is a great way to balance user experience and the cost of the VDI system you are evaluating.

Figure 3: The summary of a capacity test with steady-state and baseline insights.
Performance Monitoring in Operations Dashboard
The last feature in the 5.1 release is adding the performance view of the operations dashboard, bringing the cost, capacity, and performance of your VDI environments to the forefront. It’s a great way to communicate to your department executives in numbers and give them a story they can easily understand. In addition, the performance monitoring dashboard highlights the performance your production users are experiencing.
Many other enhancements are included with our 5.1 release, so we encourage our customers to review the release notes and our help center articles to understand more about the great updates we deliver regularly.
We owe a big thanks to our wonderful customers. We make strides with their feedback and are so happy they see value in the features they’ve suggested. We look forward to continuing to support our customers and helping our future customers gain significant value from all that Login Enterprise offers.
Download the Latest Version
Existing customers may access the updated files on the Login Enterprise Download page.
Product Release


