Login Enterprise Release 5.4 is Now Available
September 14, 2023
This week, we released Login Enterprise 5.4. This release represents a historic milestone for Login Enterprise because we’ve added a feature 99% of our customers have been asking for… Session Metrics in the Login Enterprise Web UI. This new feature will allow you to take the next step at identifying the root cause of VSImax, accelerating your ability to determine why there was a change in the EUX Score and reasons for impacts in availability.
Session Metrics tell you why…
Until our last release (5.3), I have been collecting my primary session metrics directly from Windows Performance Monitor (PerfMon), pulling them into Excel, and correlating them with our EUX Score, VSImax, Login Performance, and Application Metrics. Session metrics have always served as my heuristics when understanding the “why” behind the performance and availability results I was getting for capacity testing and production monitoring.
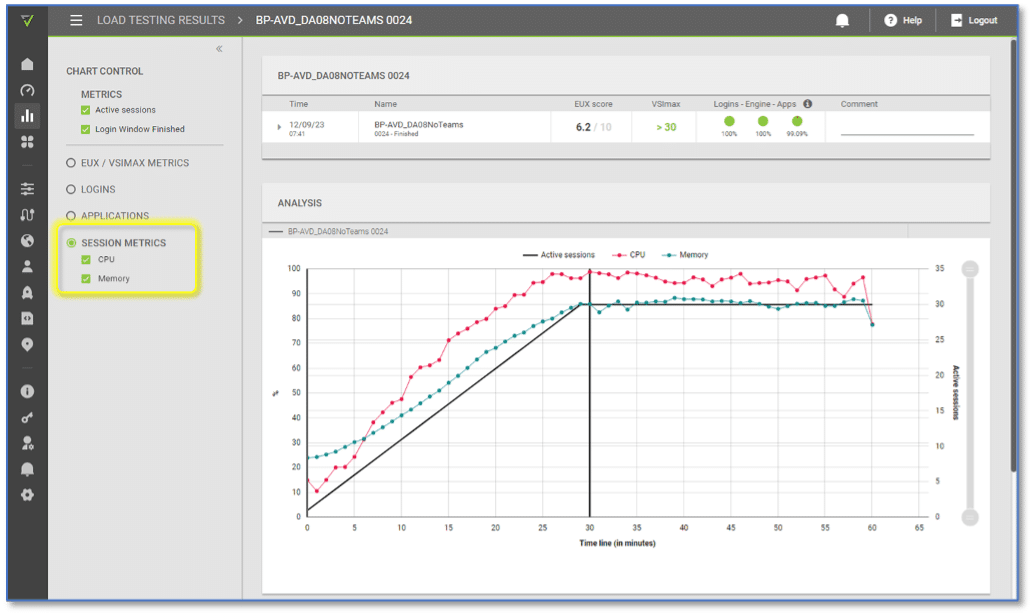
This step in my analysis is as easy as clicking on the metrics I want to view. By default, Login Enterprise gives you CPU and Memory Utilization, the most common bottlenecks in VDI. As you can see below, I am at my max capacity sweet spot because I touch 100% CPU utilization just a couple of times while memory is less than 90% utilized. See the graphic below.

Figure 1 – A look at the new Login Enterprise Load Test Results with Session Metrics
In addition to seeing session metrics for Load Tests, you can also see them for Continuous Testing, giving you an idea of resource utilization in your production environment.
While the default session metric group only gives us CPU and Memory Utilization, adding more PerfMon metrics for Login Enterprise to collect is possible. For now, this can be done via our Public Web API.
My favorite PerfMon counters to collect are as follows:
- CPU – % Processor Time
- “Disk Read Bytes/sec,”
- Disk – “Disk Write Bytes/sec,”
- Disk – “Current Disk Queue Length”
- Disk – “Avg. Disk sec/Read”,
- Disk – “Avg. Disk sec/Write”
Wrap up
Along with Session Metrics, Login Enterprise 5.4 offers more ways to get the events and logs you need for troubleshooting, enable or disable virtual user accounts in groups, and many Web UI updates that make navigating, using, and browsing Login Enterprise much easier.
Many other enhancements are included with our 5.4 release, so we encourage our customers to review the release notes and our help center articles to understand more about the significant updates we deliver regularly.
We owe a big thanks to our wonderful customers. We make strides with their feedback and are so happy they see value in the features they’ve suggested. We look forward to continuing to support our customers and helping our future customers gain significant weight from all that Login Enterprise has to offer.
Download the Latest Version
Existing customers may access the updated files on the Login Enterprise Download page.
Product Release


